Visualizing Bioelectric Flow: Streamlines and Stream Surfaces
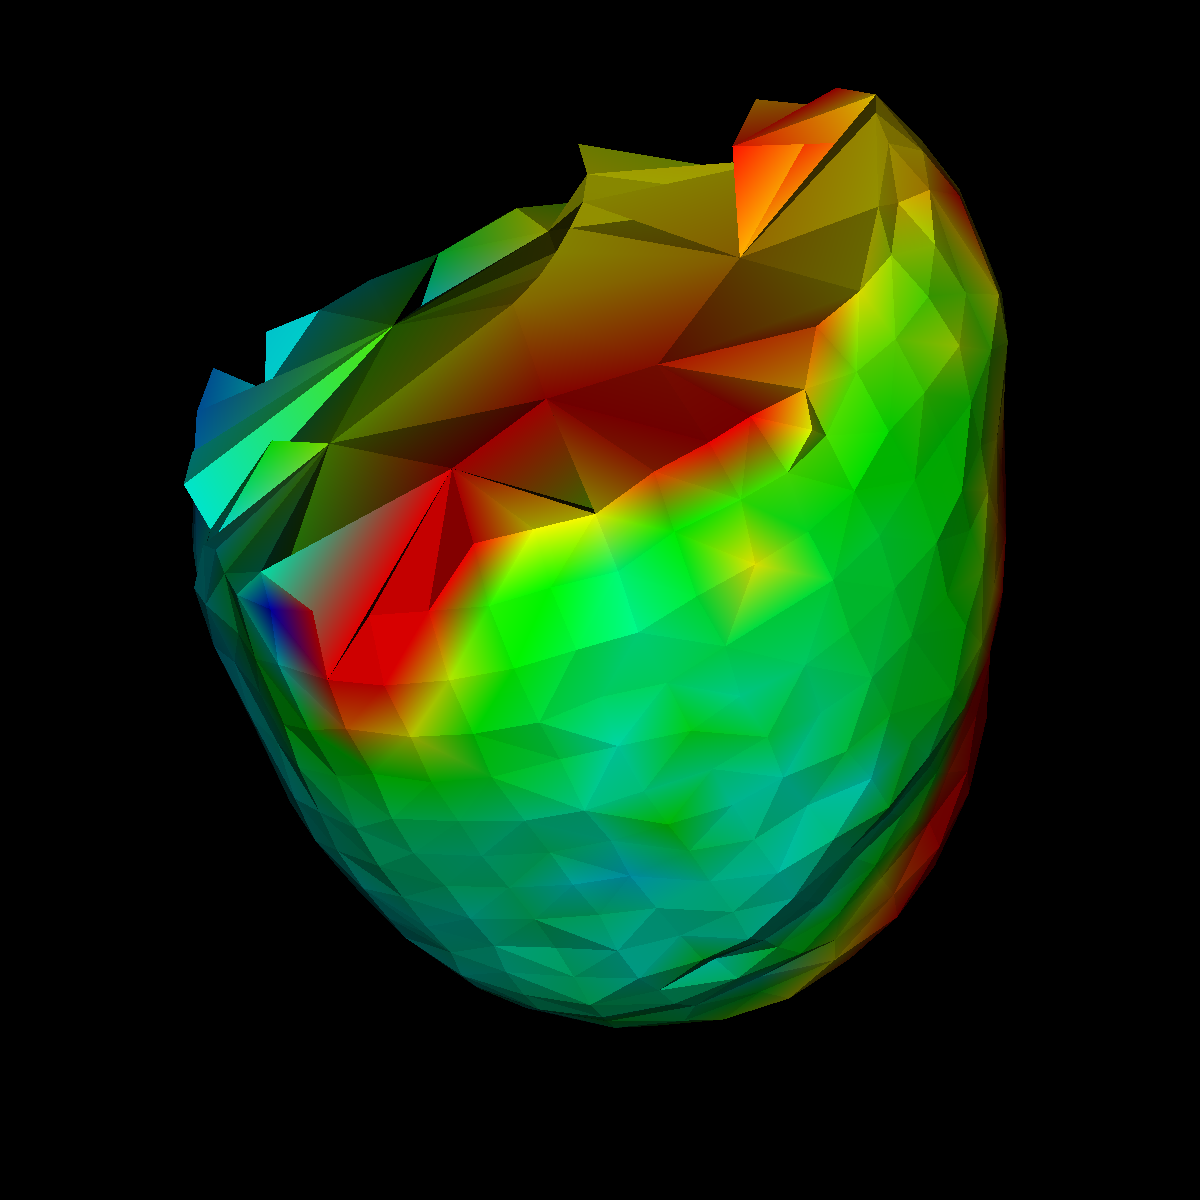
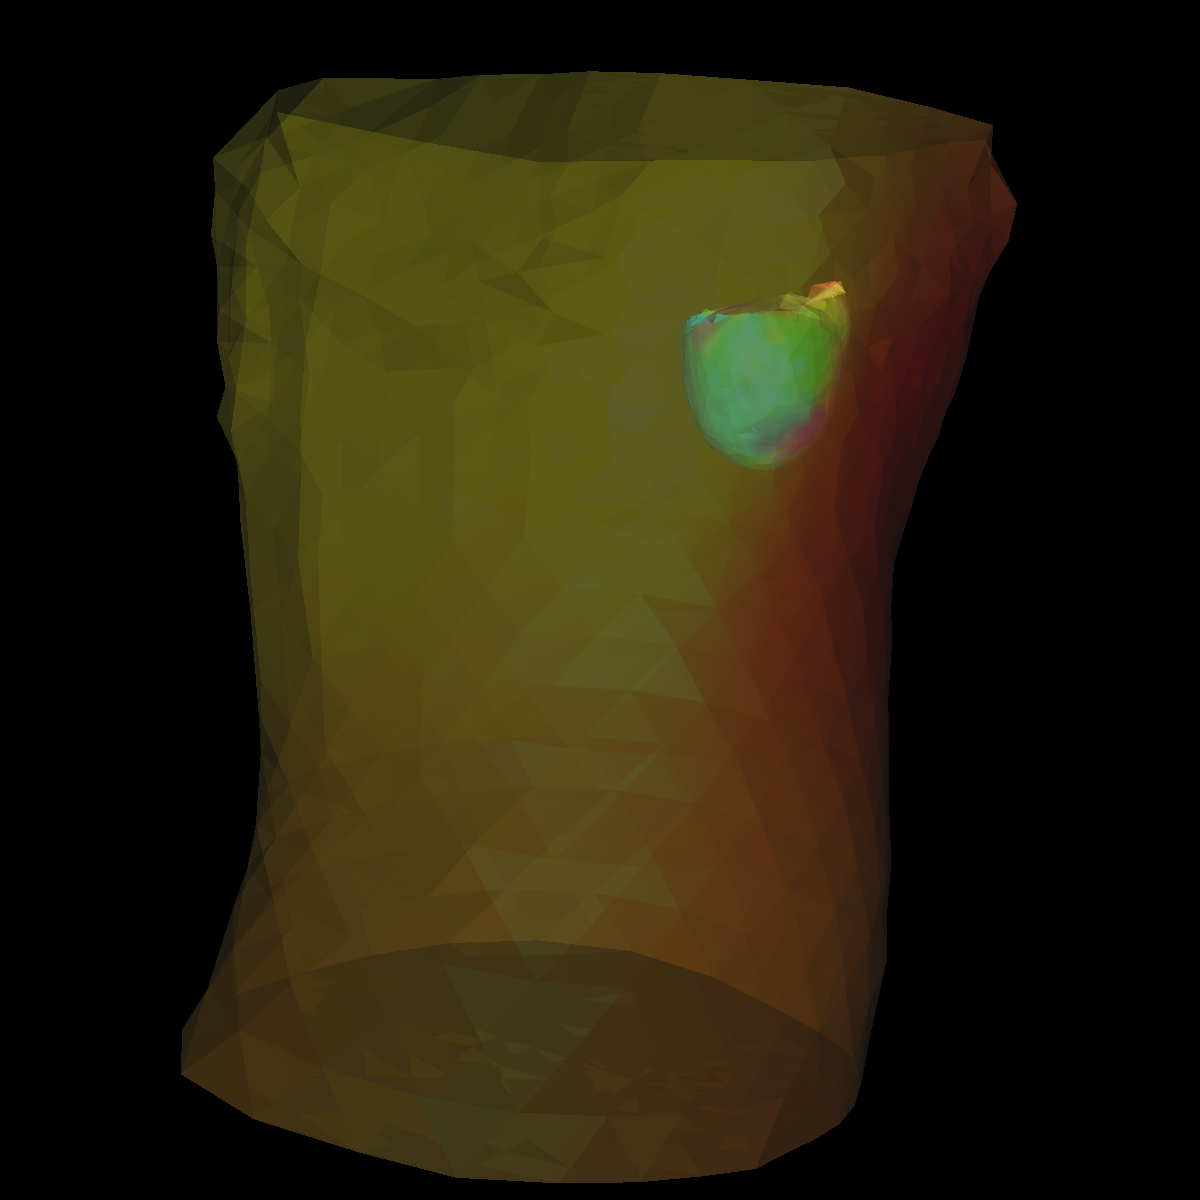
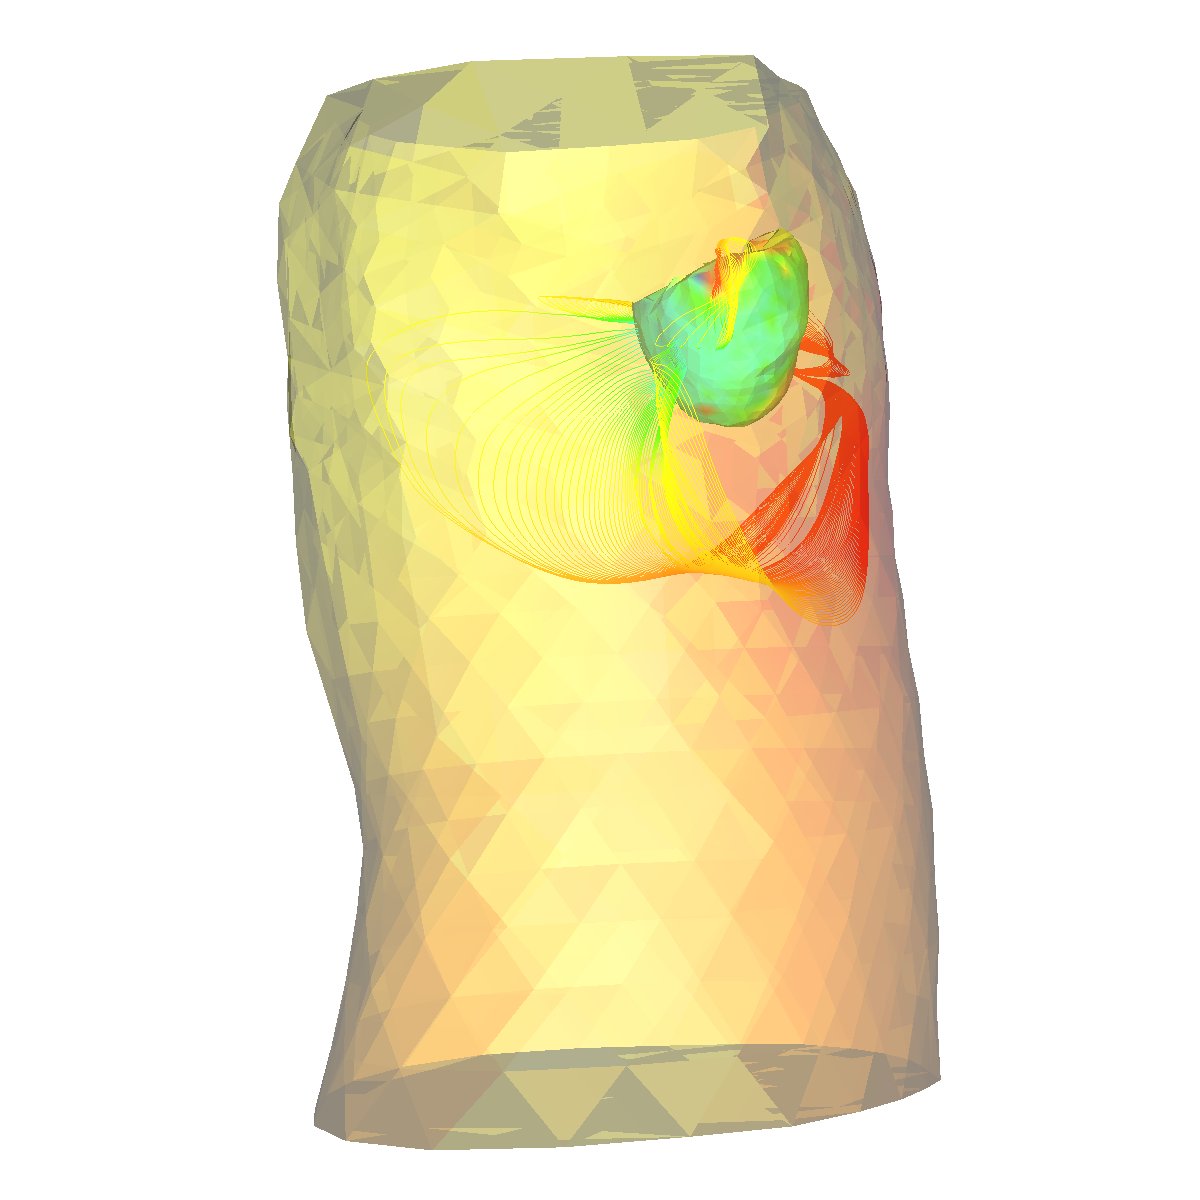
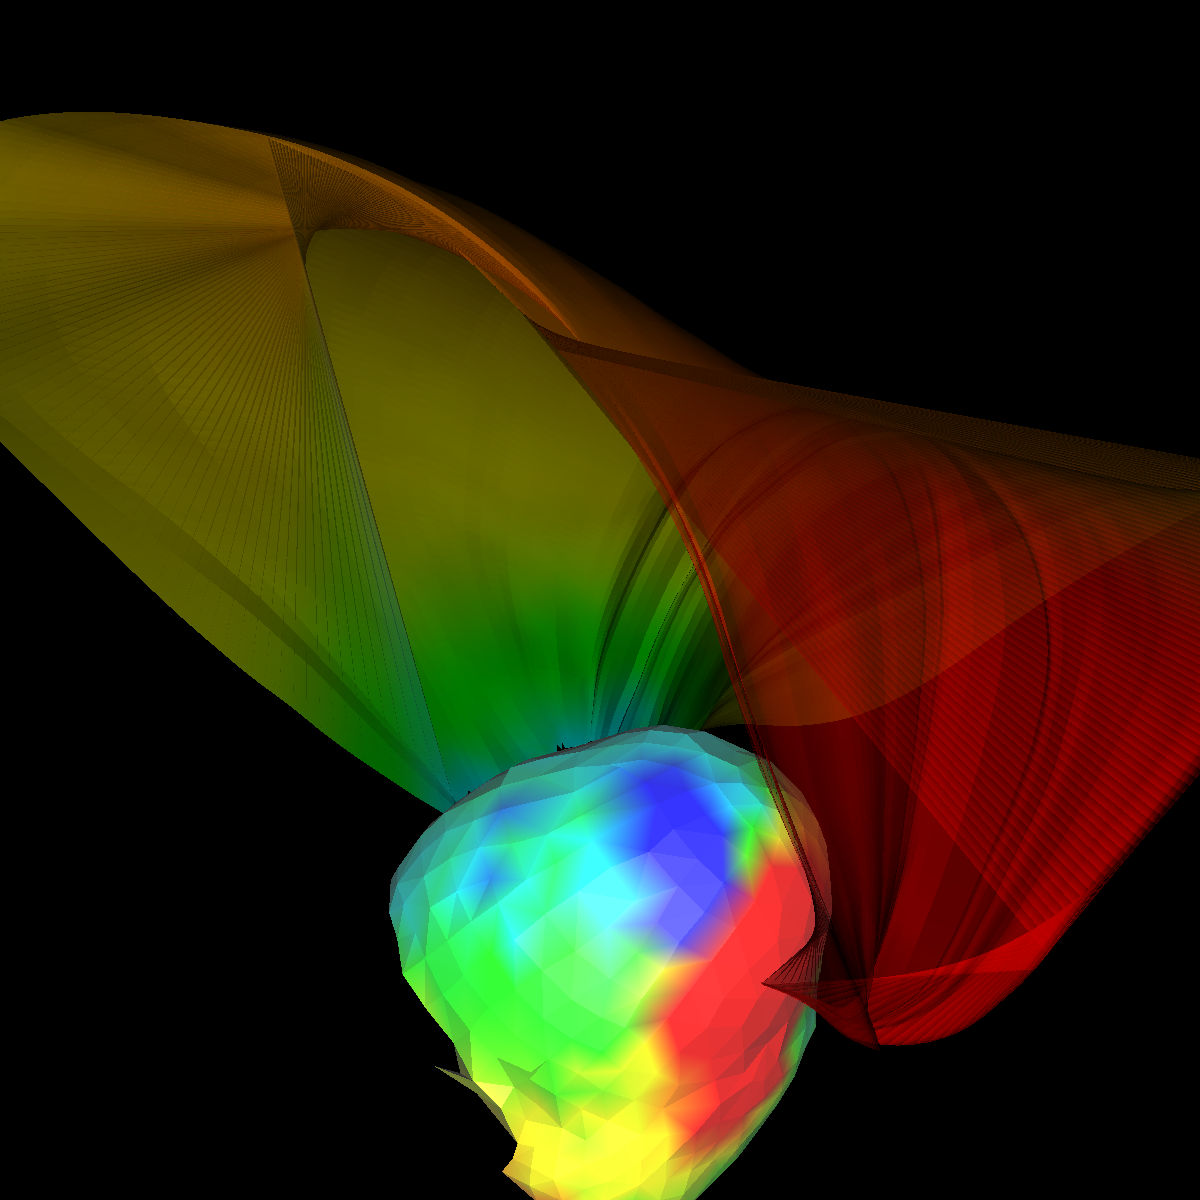
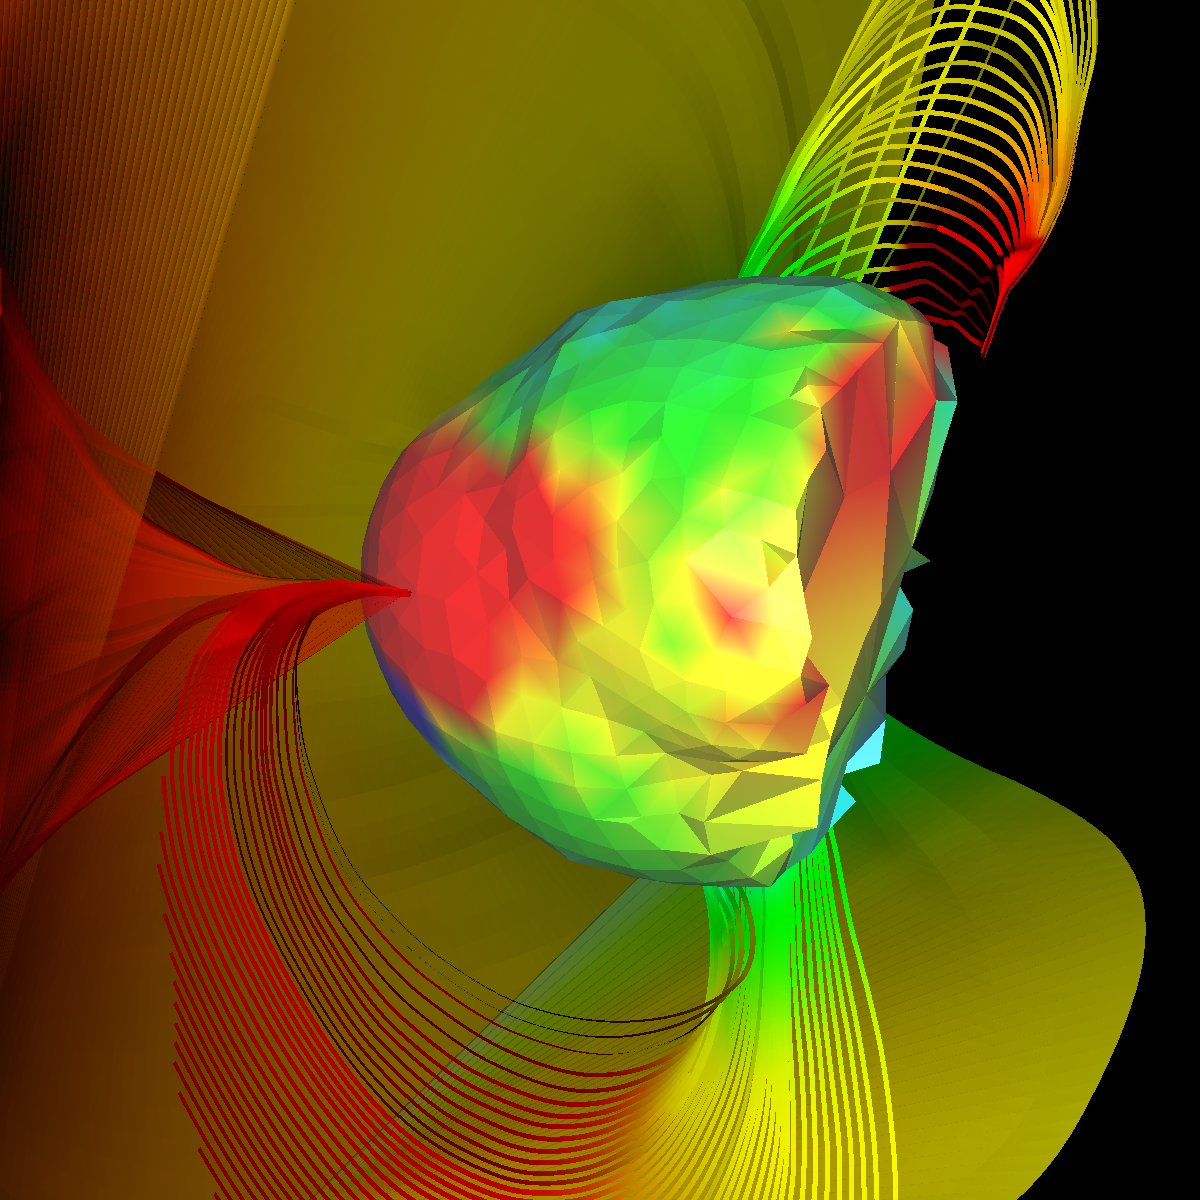
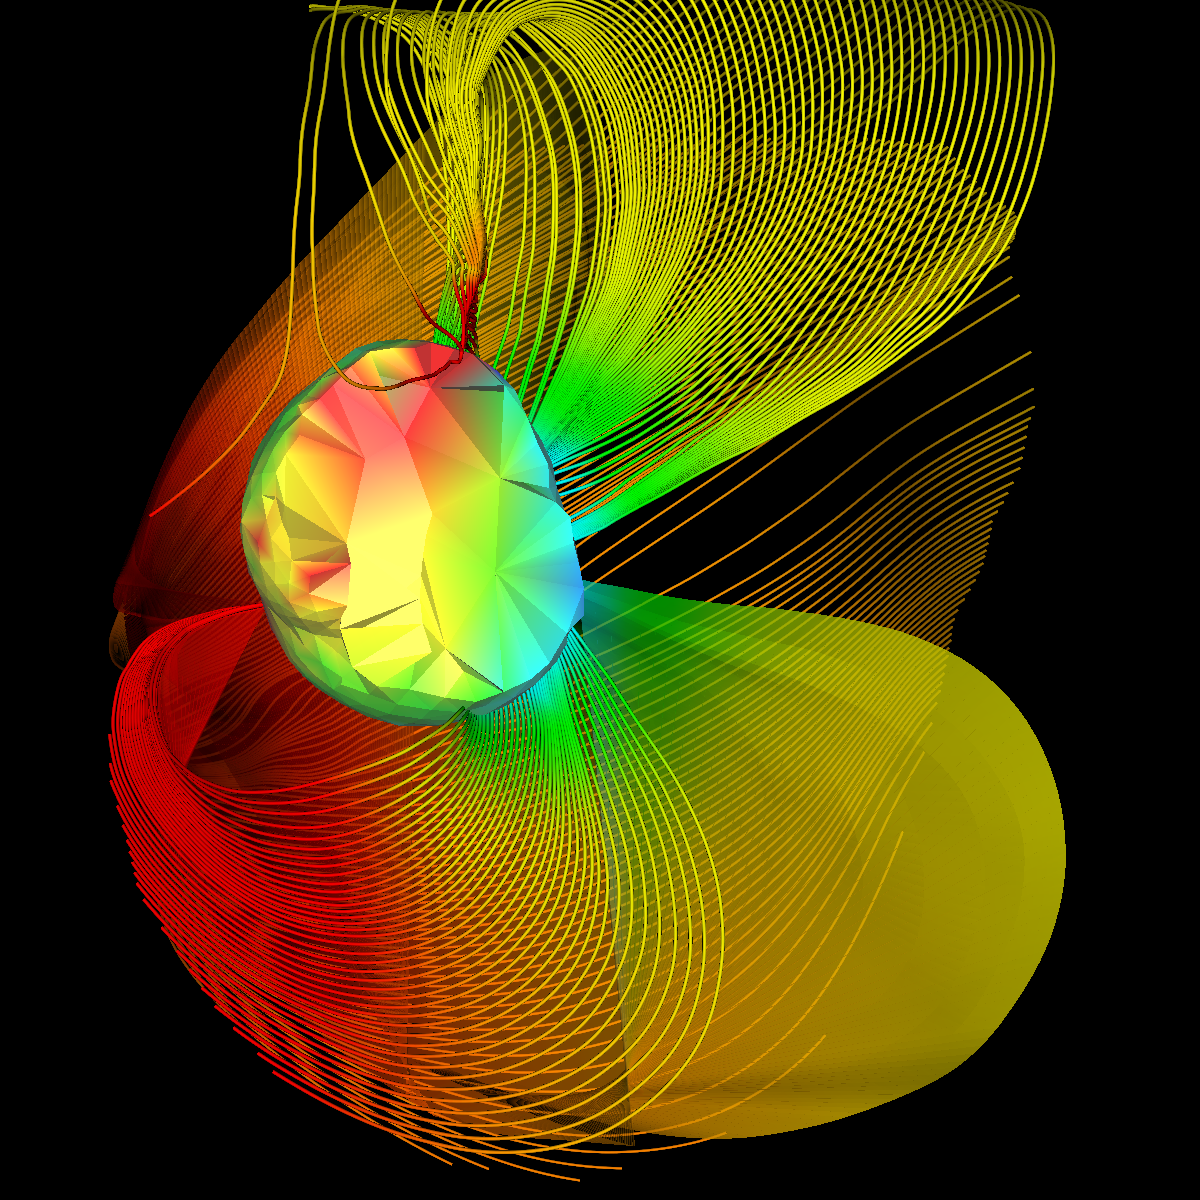
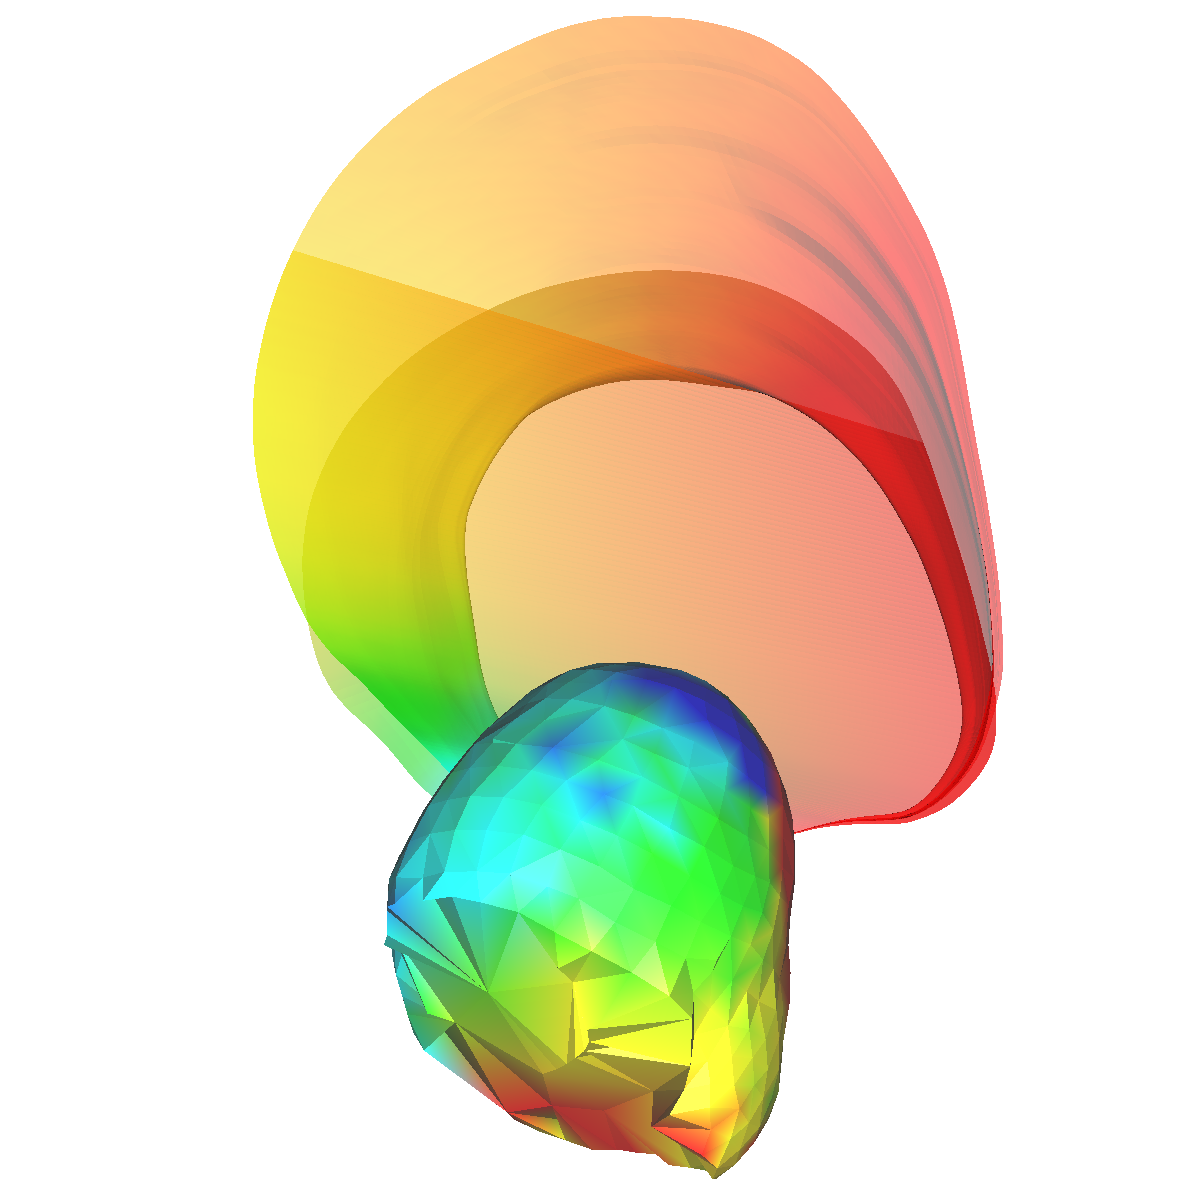
Visualizing the Bioelectrical Activity We first display the skin and epicardium with a red to blue color map. The color mapping significantly indicates potential sink and source locations on the epicardium. |
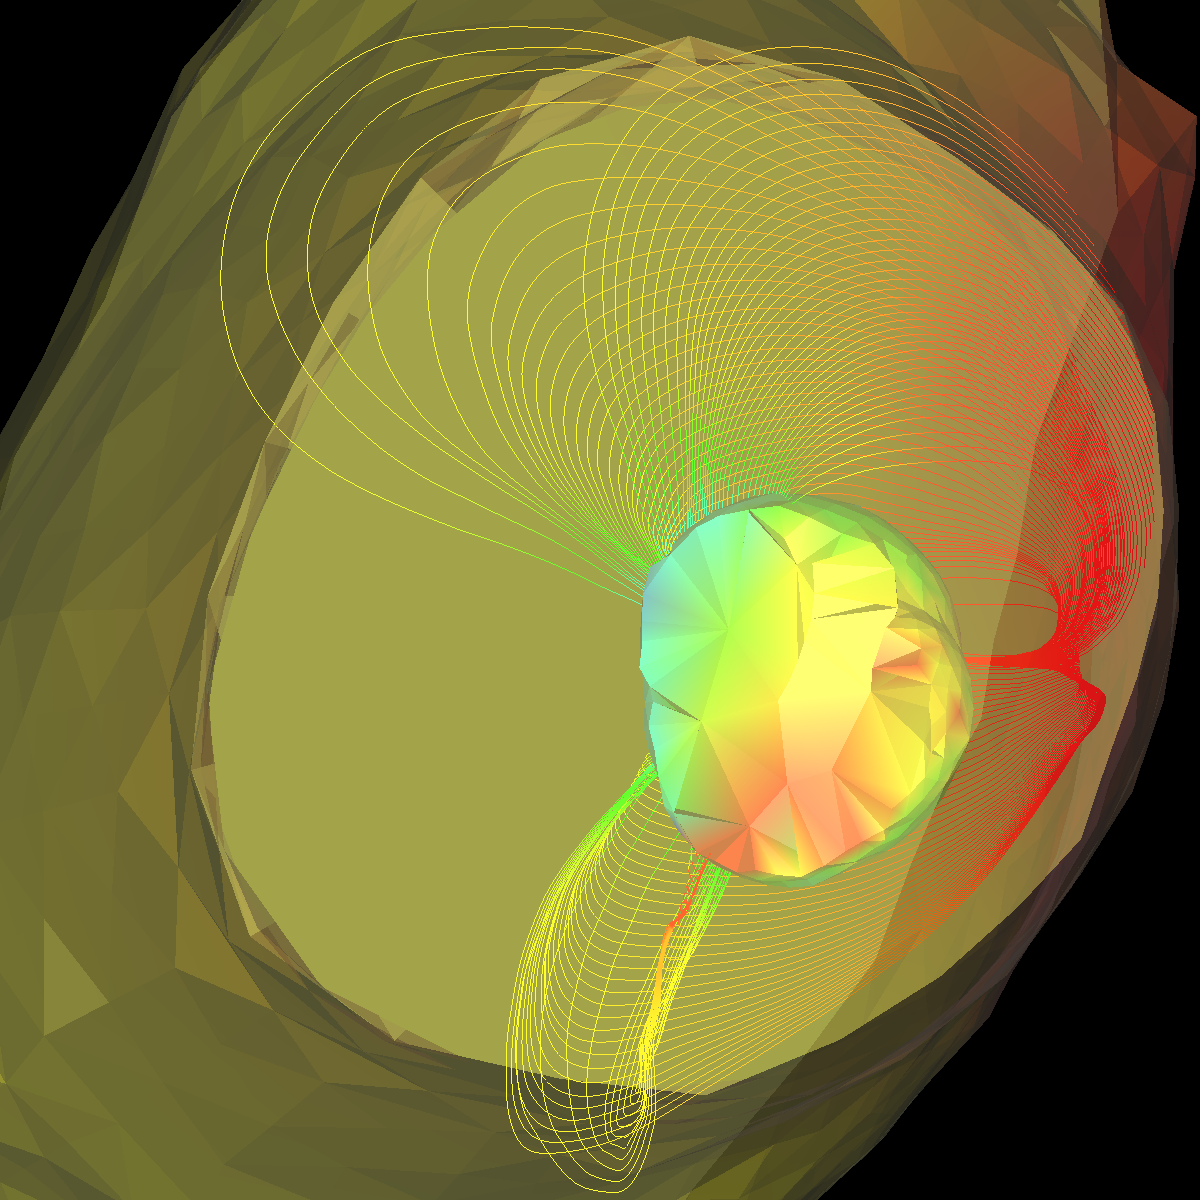
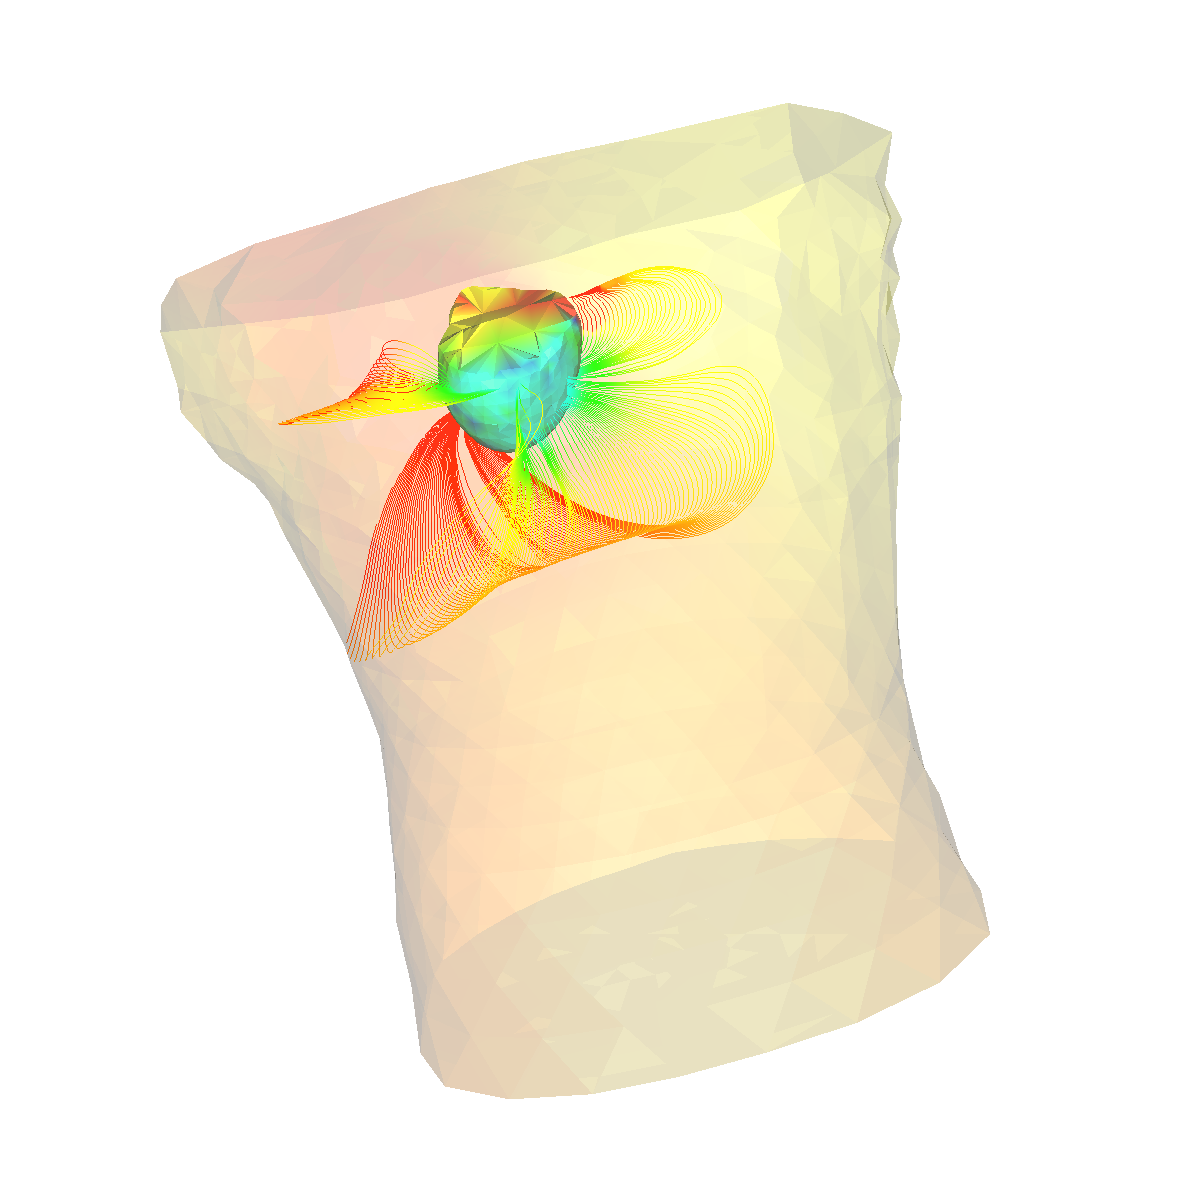
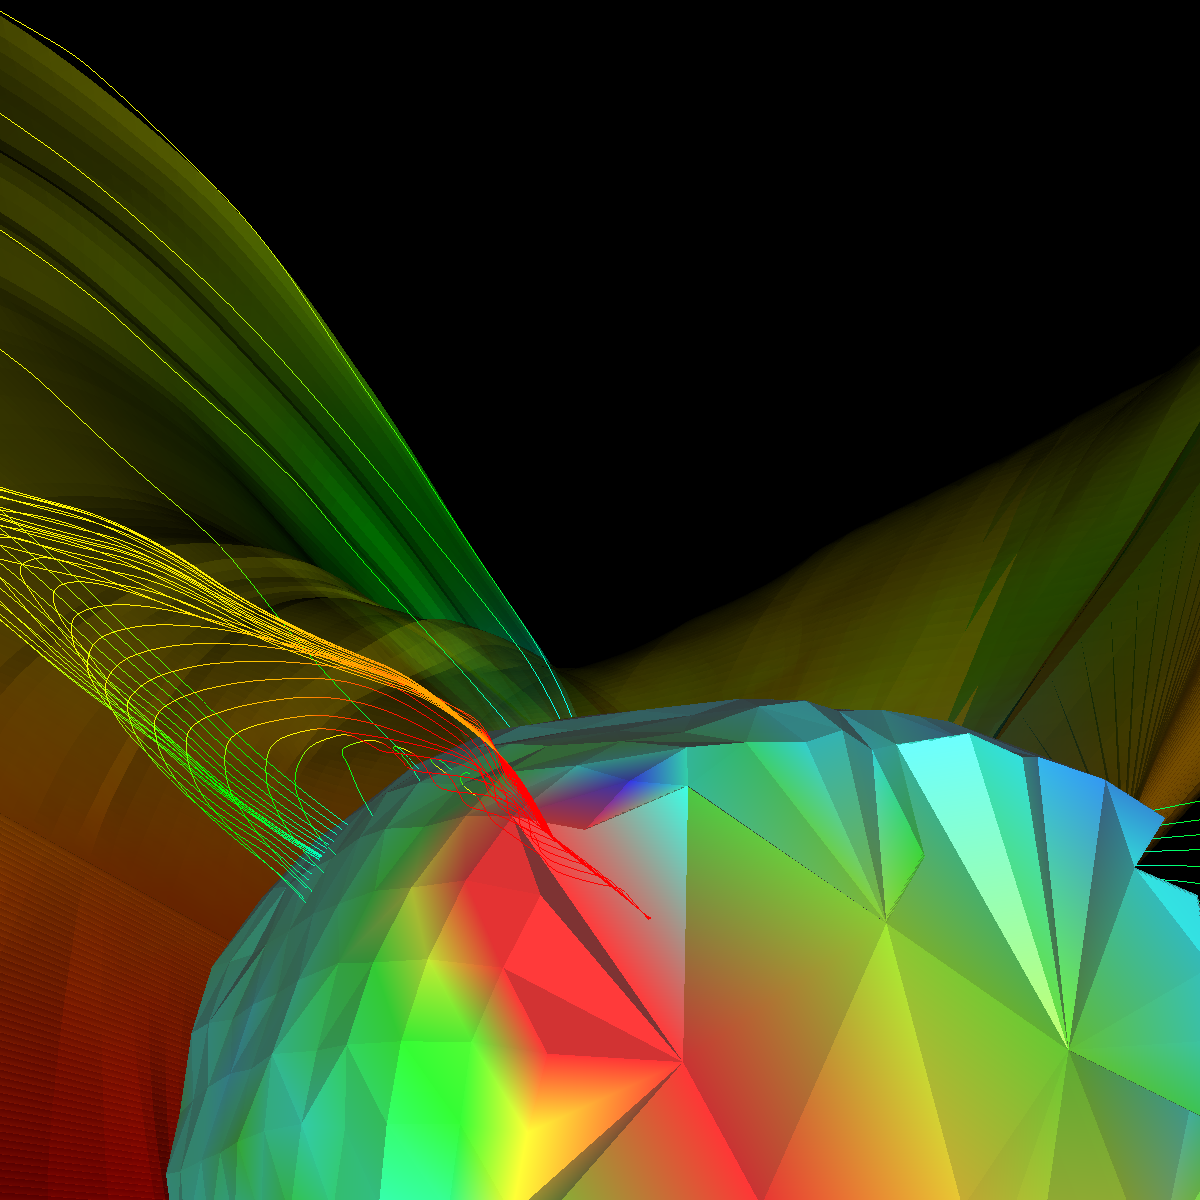
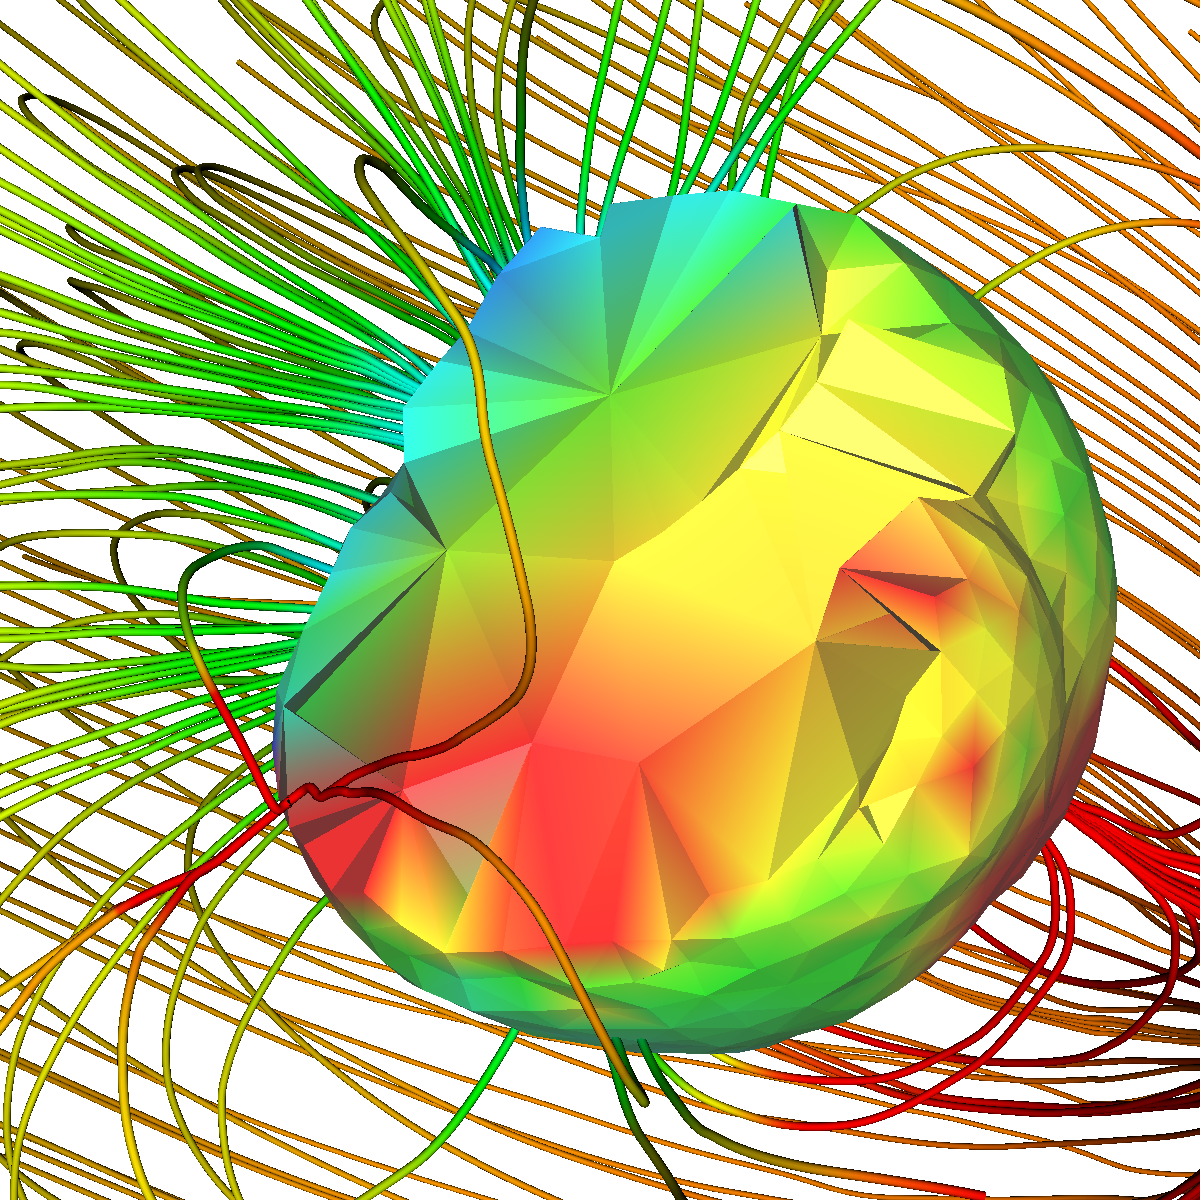
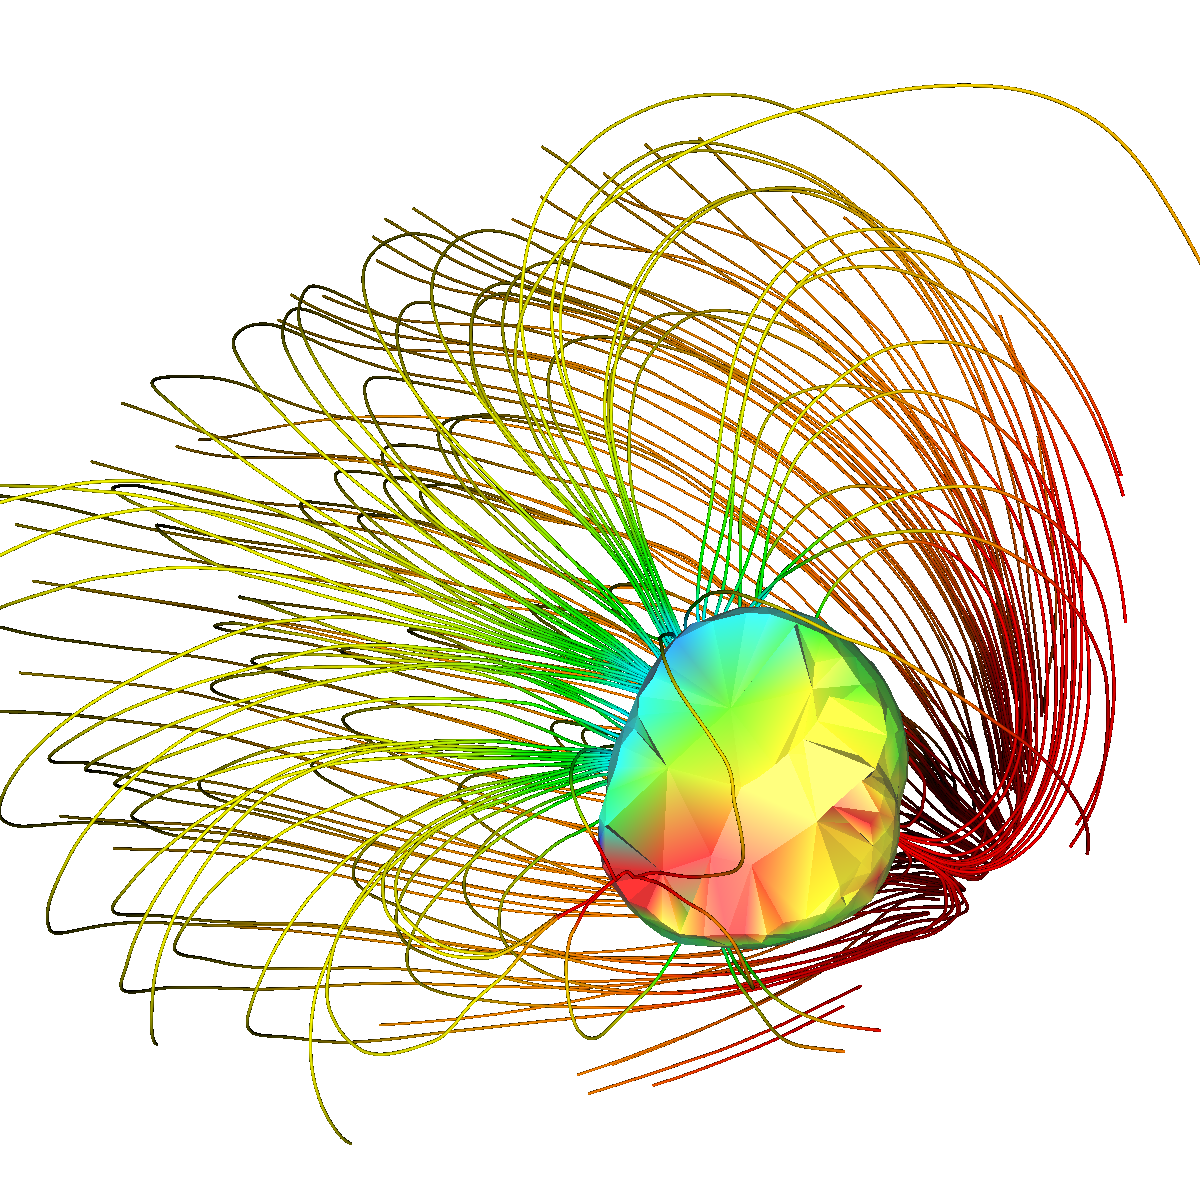
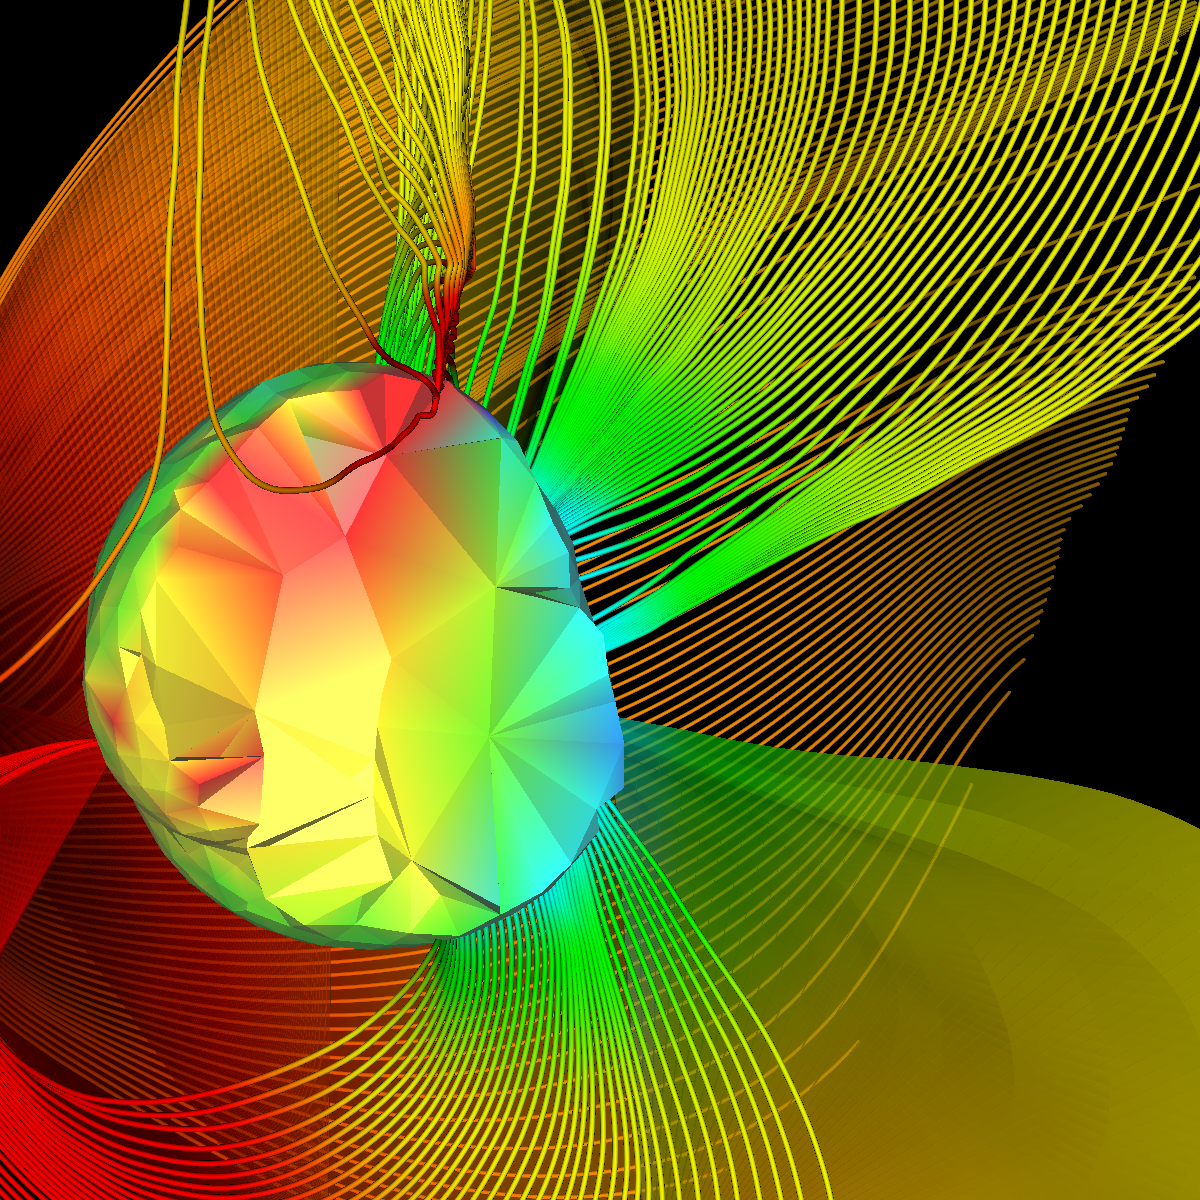
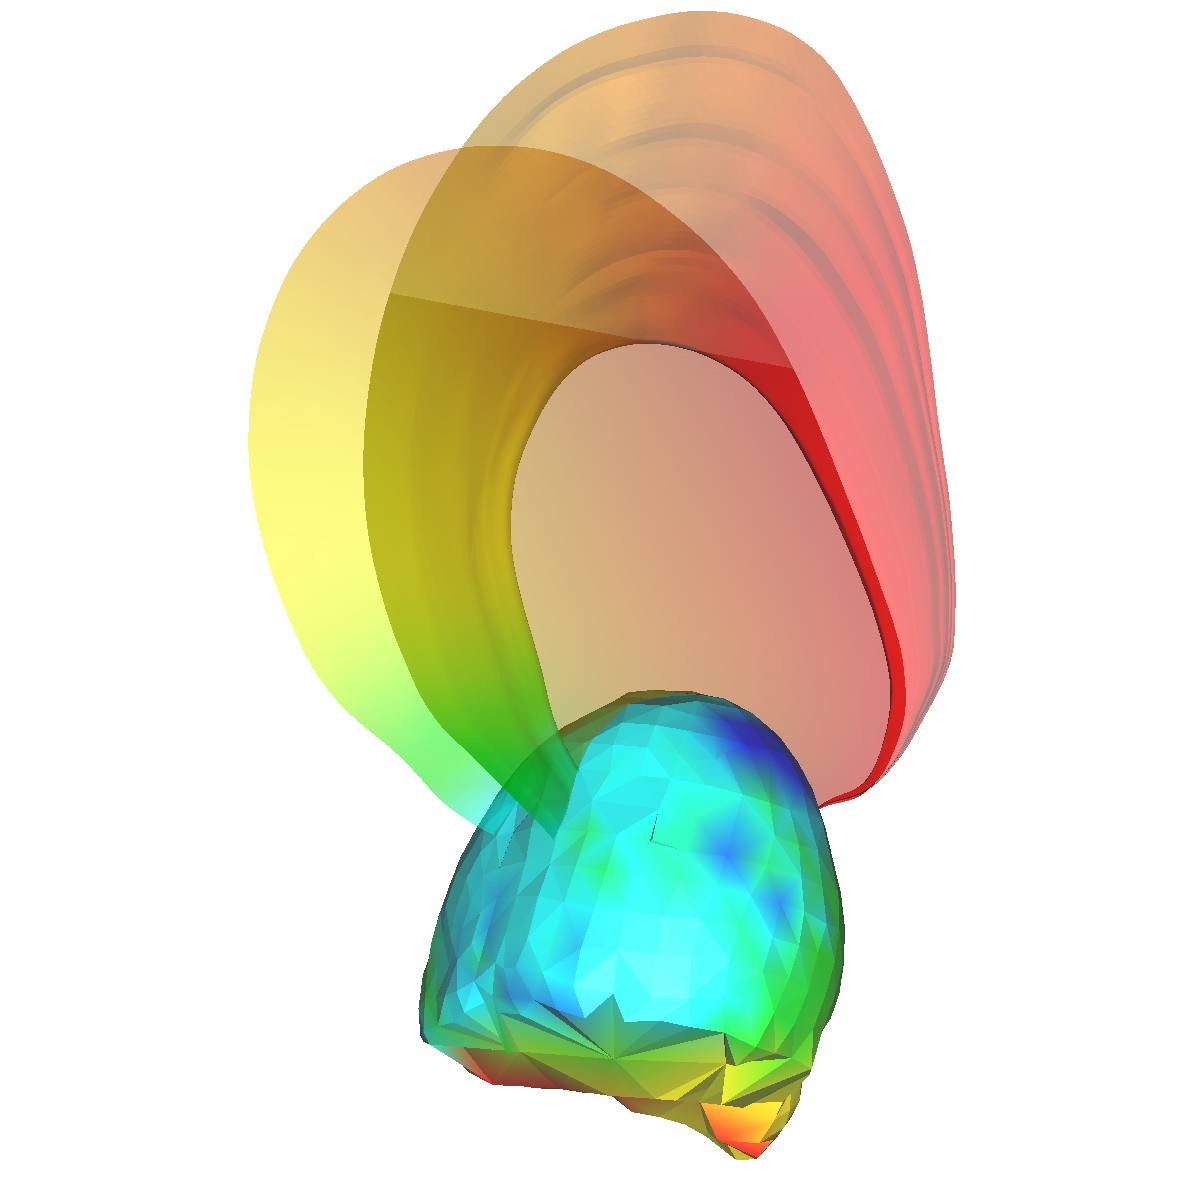
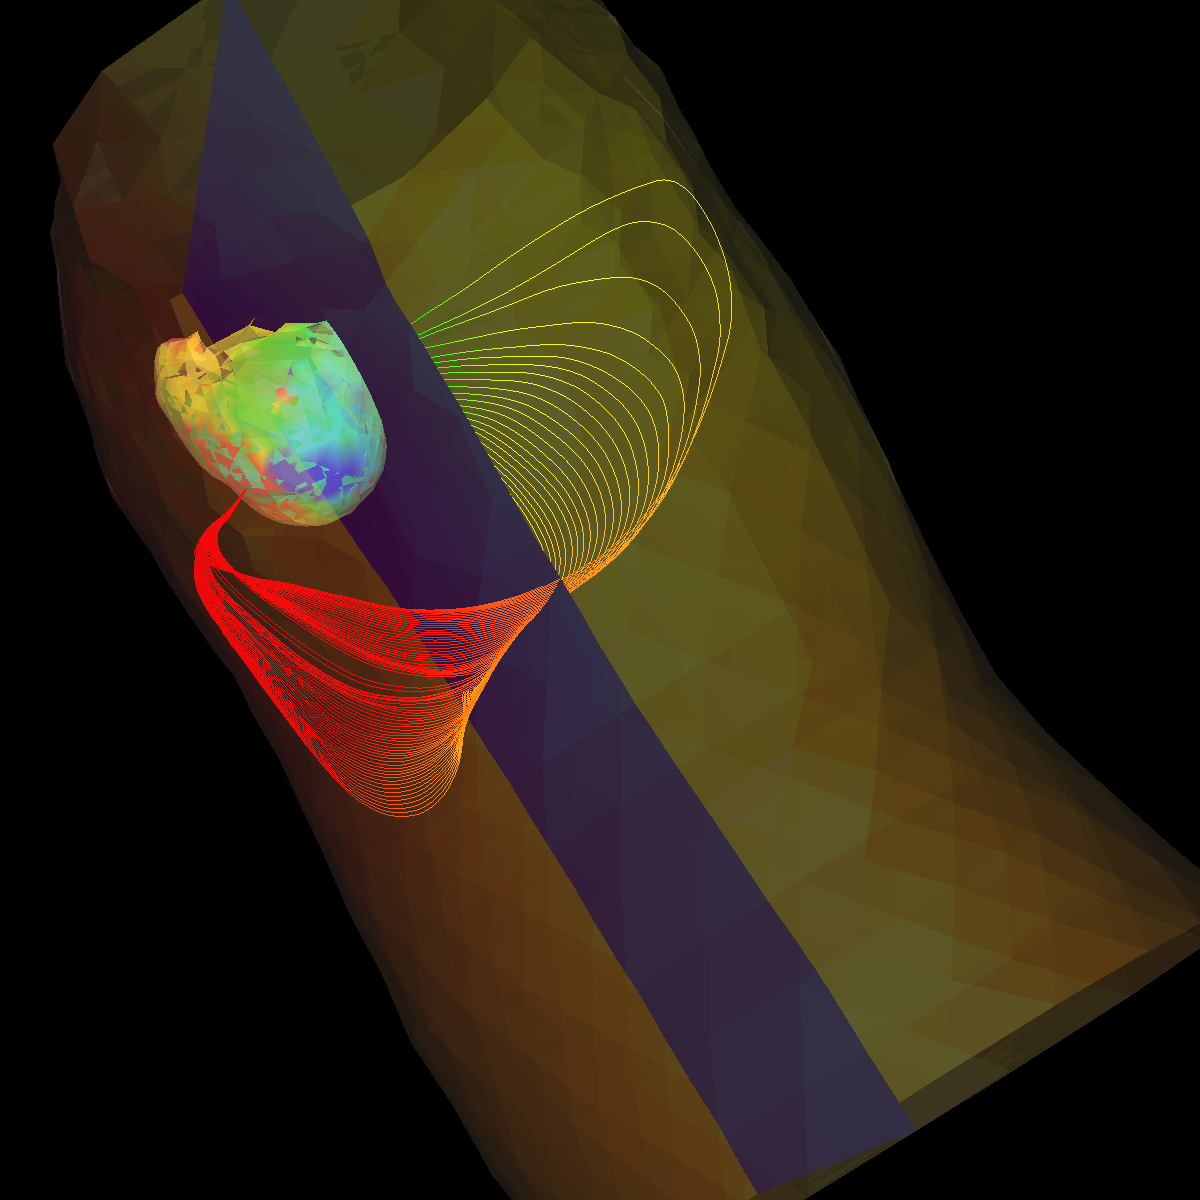
Part 1.1: Streamlines Streamlines are initially seeded along two lines defined by two points each [(5 -100 200), (5 100 200)] and the second line is [(5 -100 300),(5 100 300)]. This essentially seeds streamlines from below the epicardium and above it. This seeding allows us to capture potential sinks and sources. The color map indicates potential sinks/sources color coded as blue/cyan and red. The red sink/source is more clearly defined as the streamlines converge to a much smaller region whereas the other streamlimes enter the epicardium in a circular pattern and thus not as well-defined. The streamlines could have been identified as sinks or sources by simply intergrating in one direction instead of both. We could then determine the direction of the streamlines and thus the type of critical point (sink, saddle, source). The "Visual Analysis of Bioelectric Fields" also provided intuition on various aspects such as seeding and critical points with respect to the epicardium. |
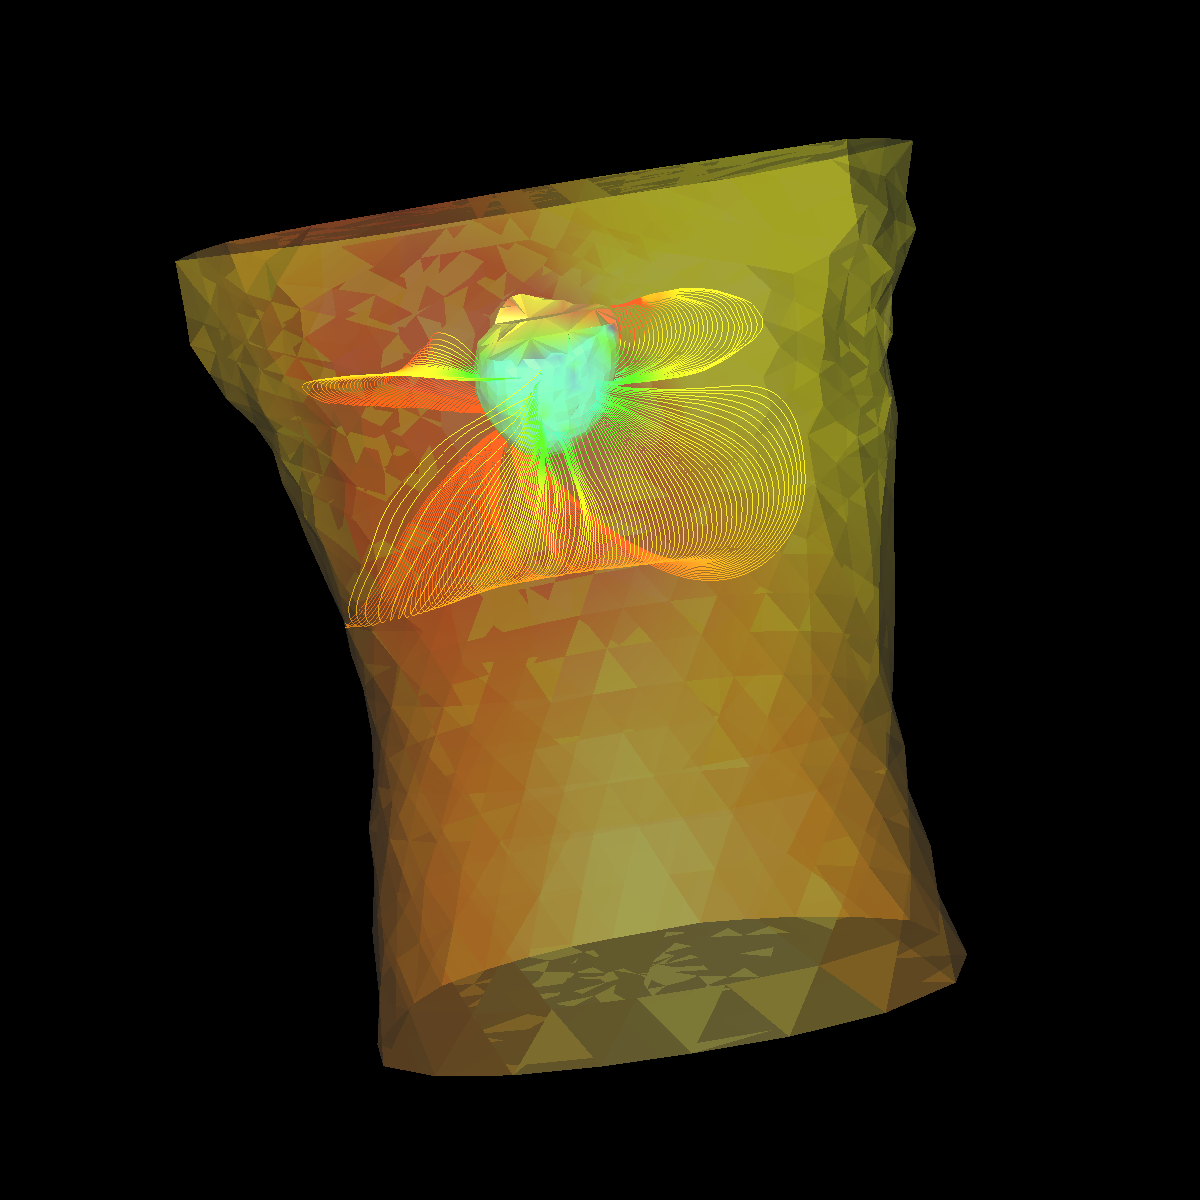
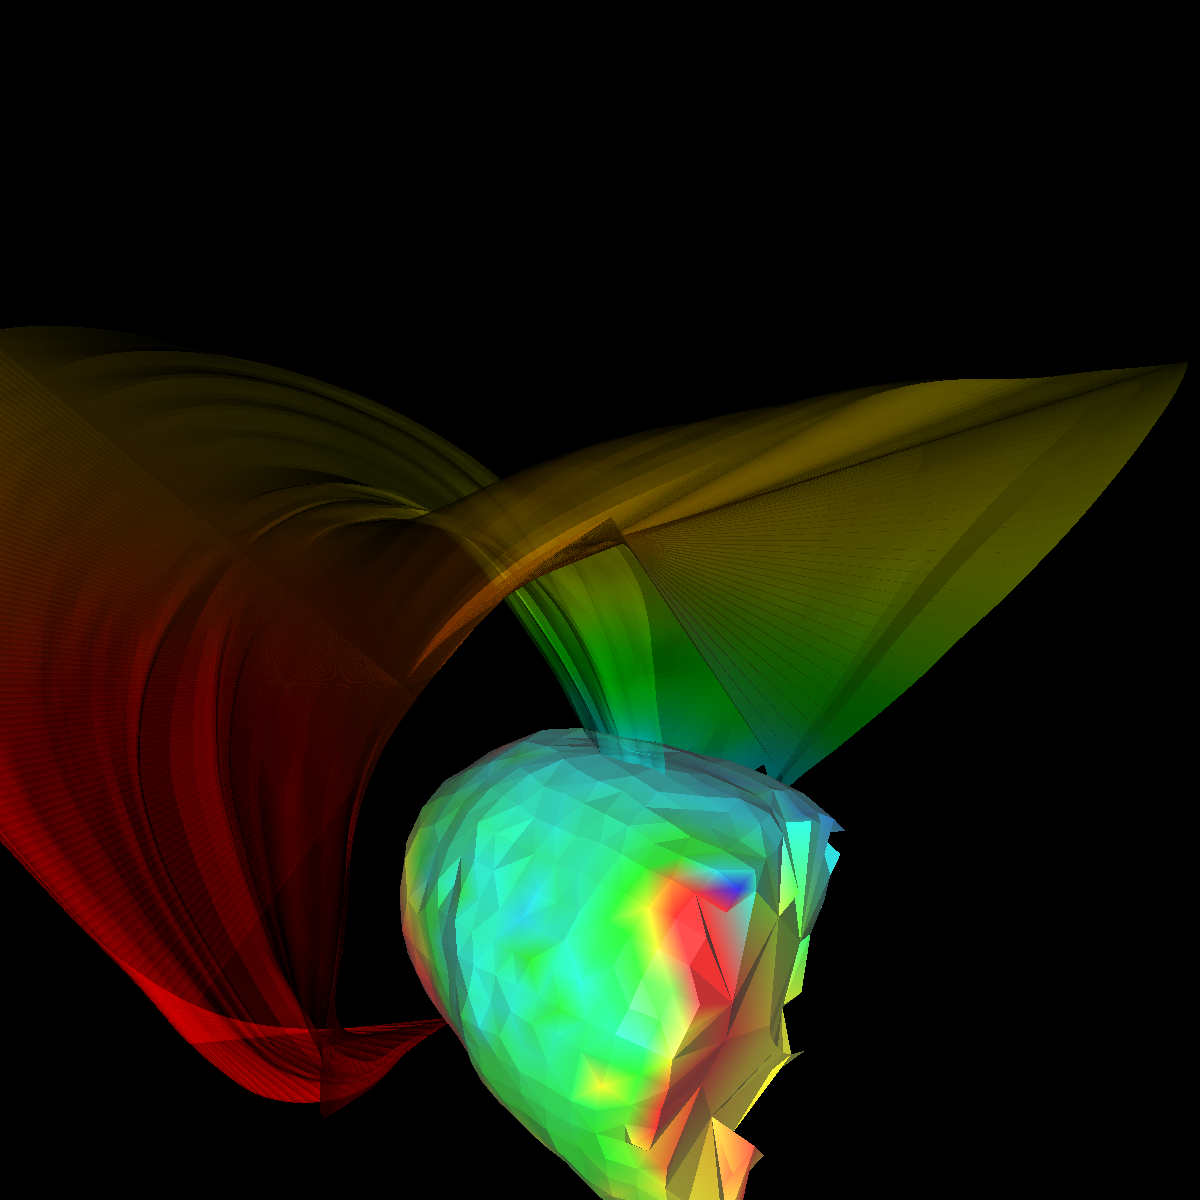
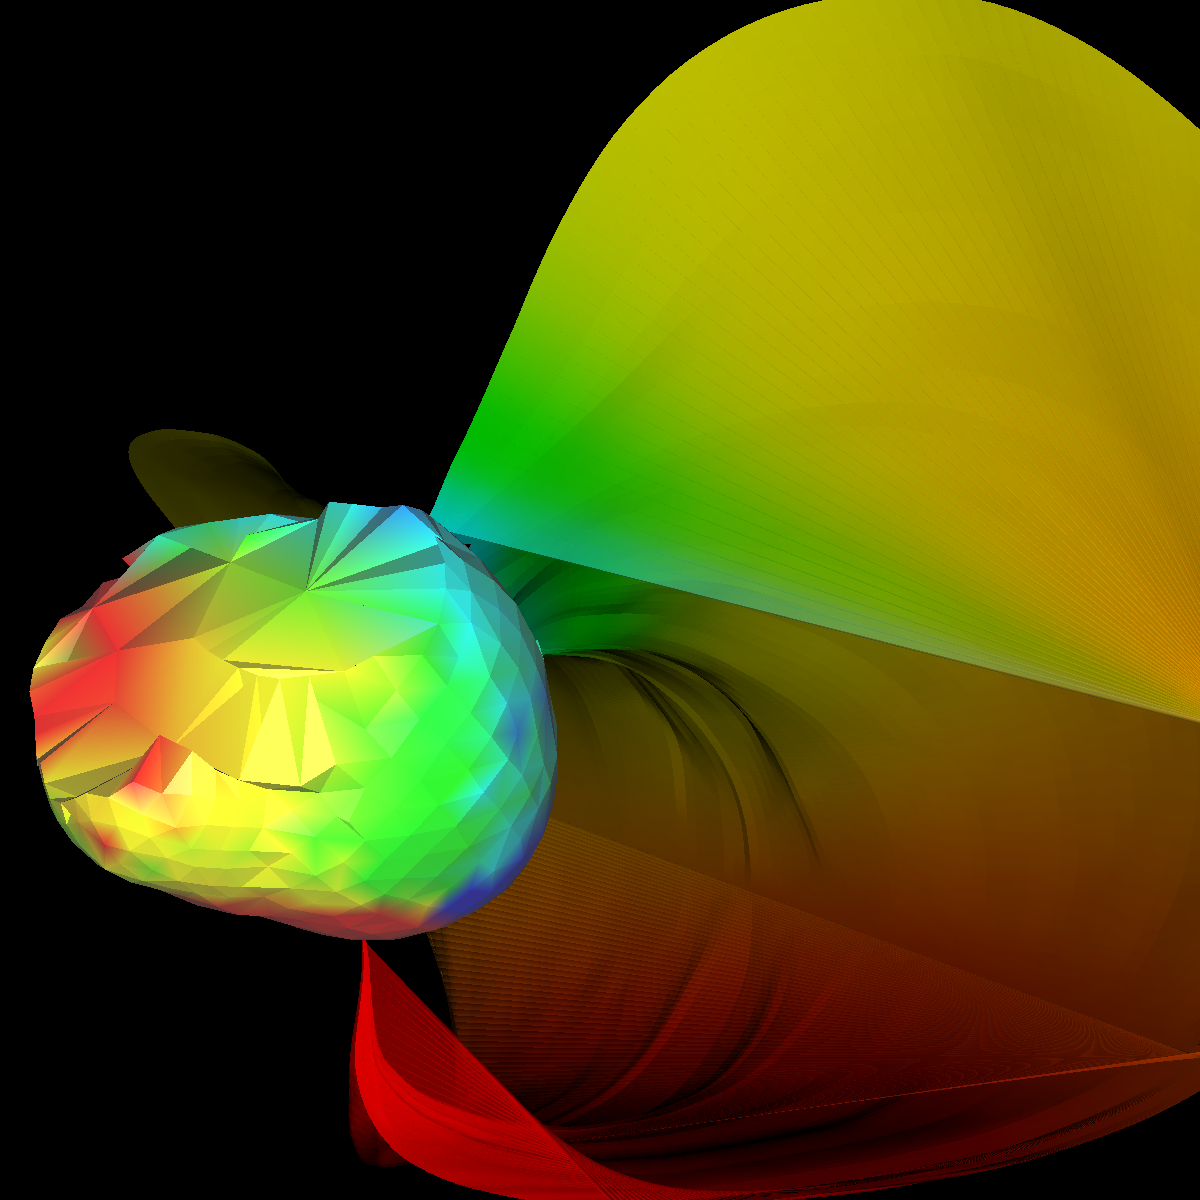
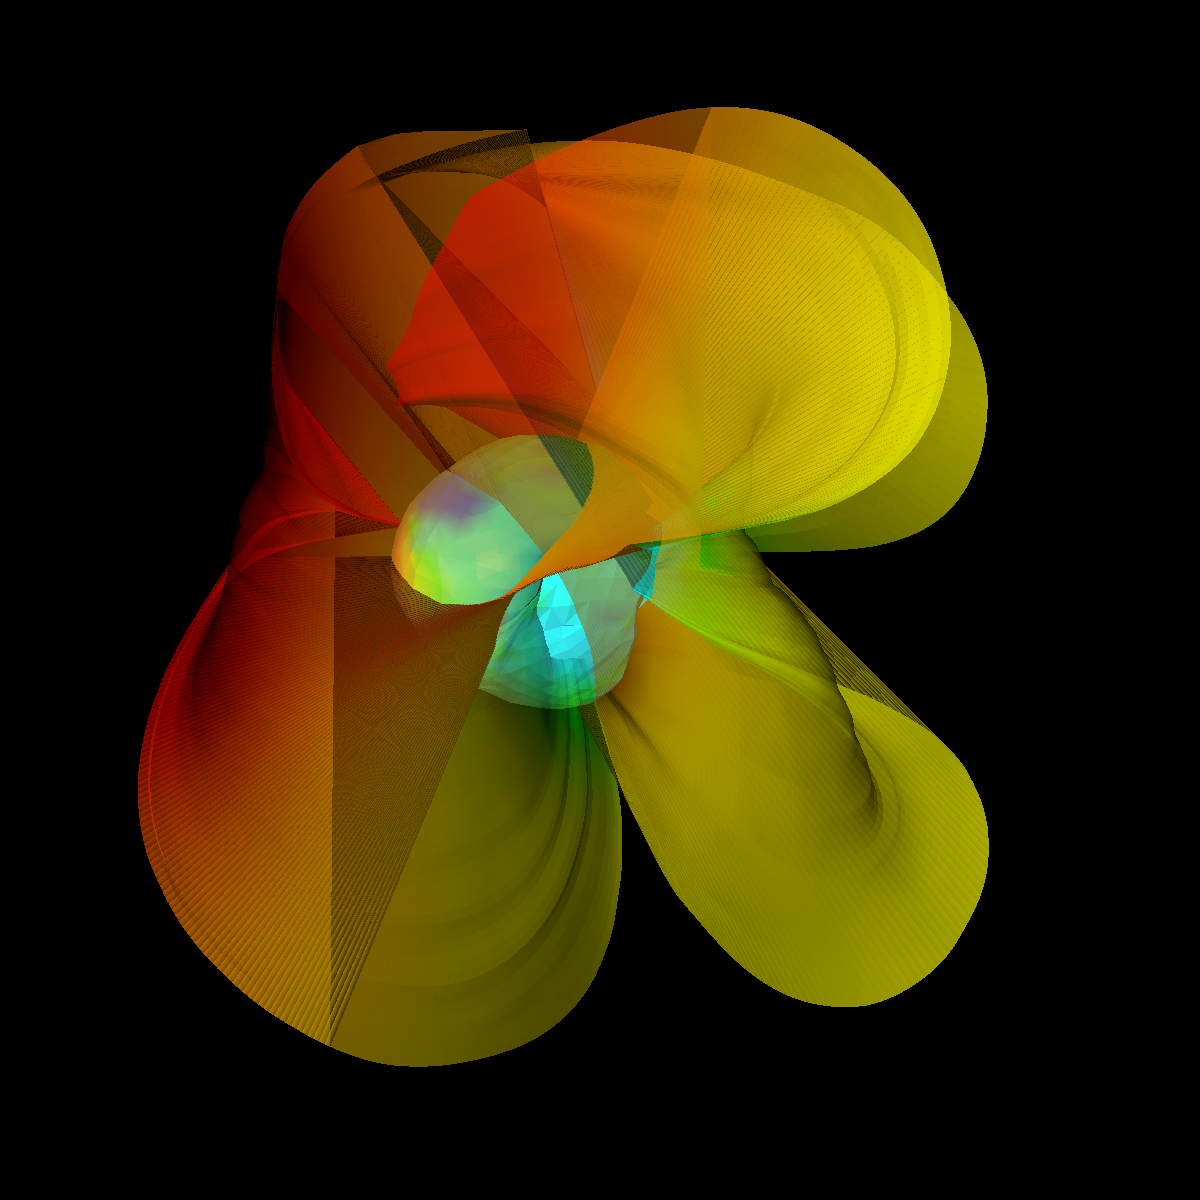
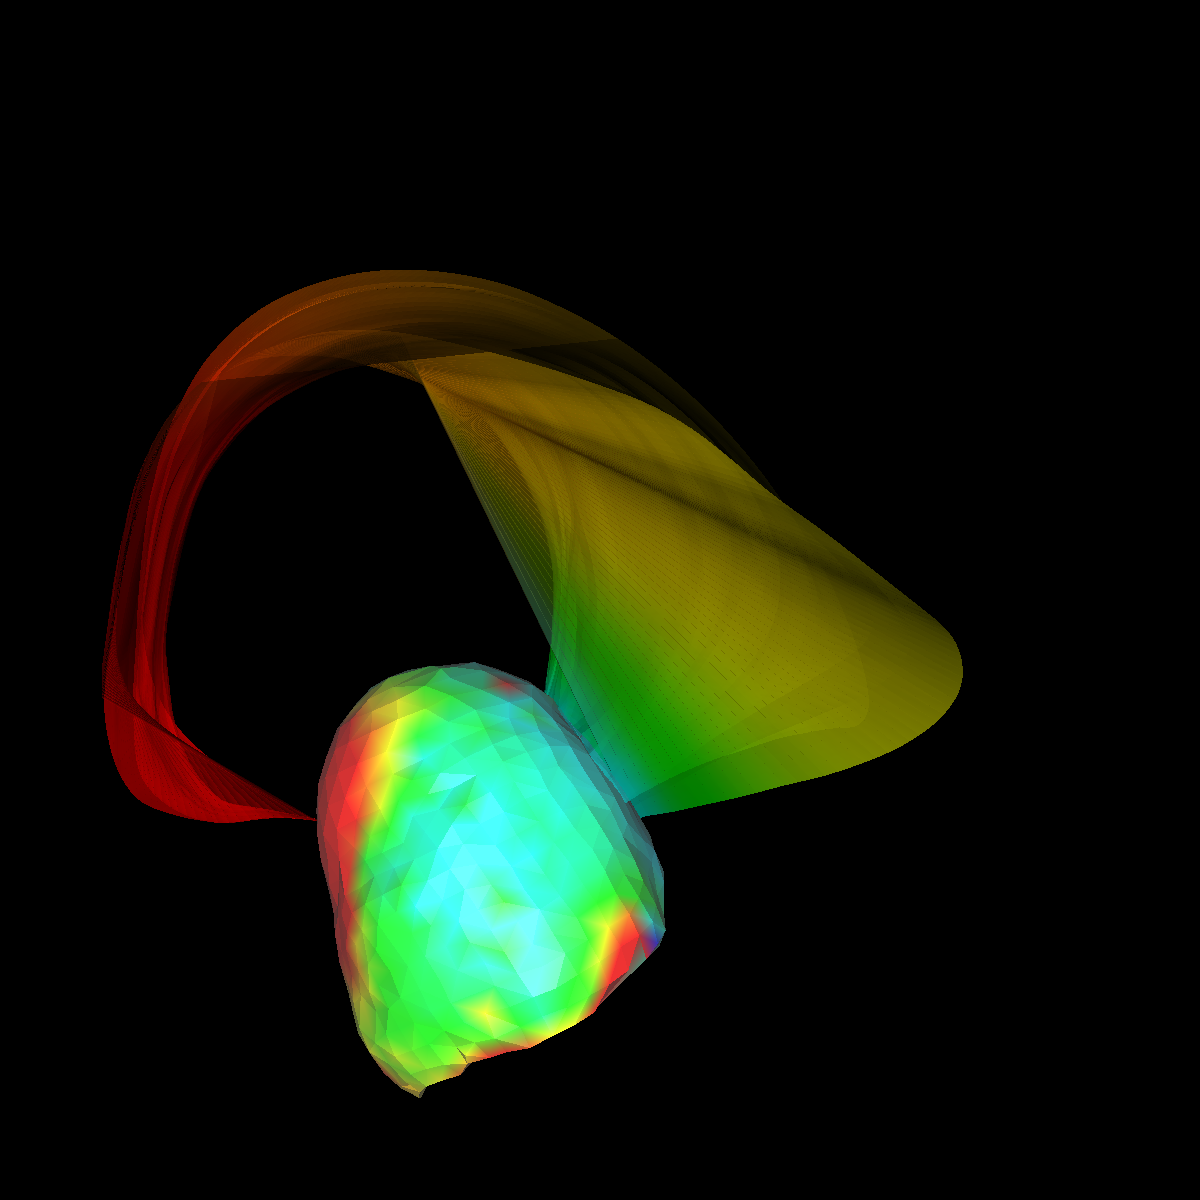
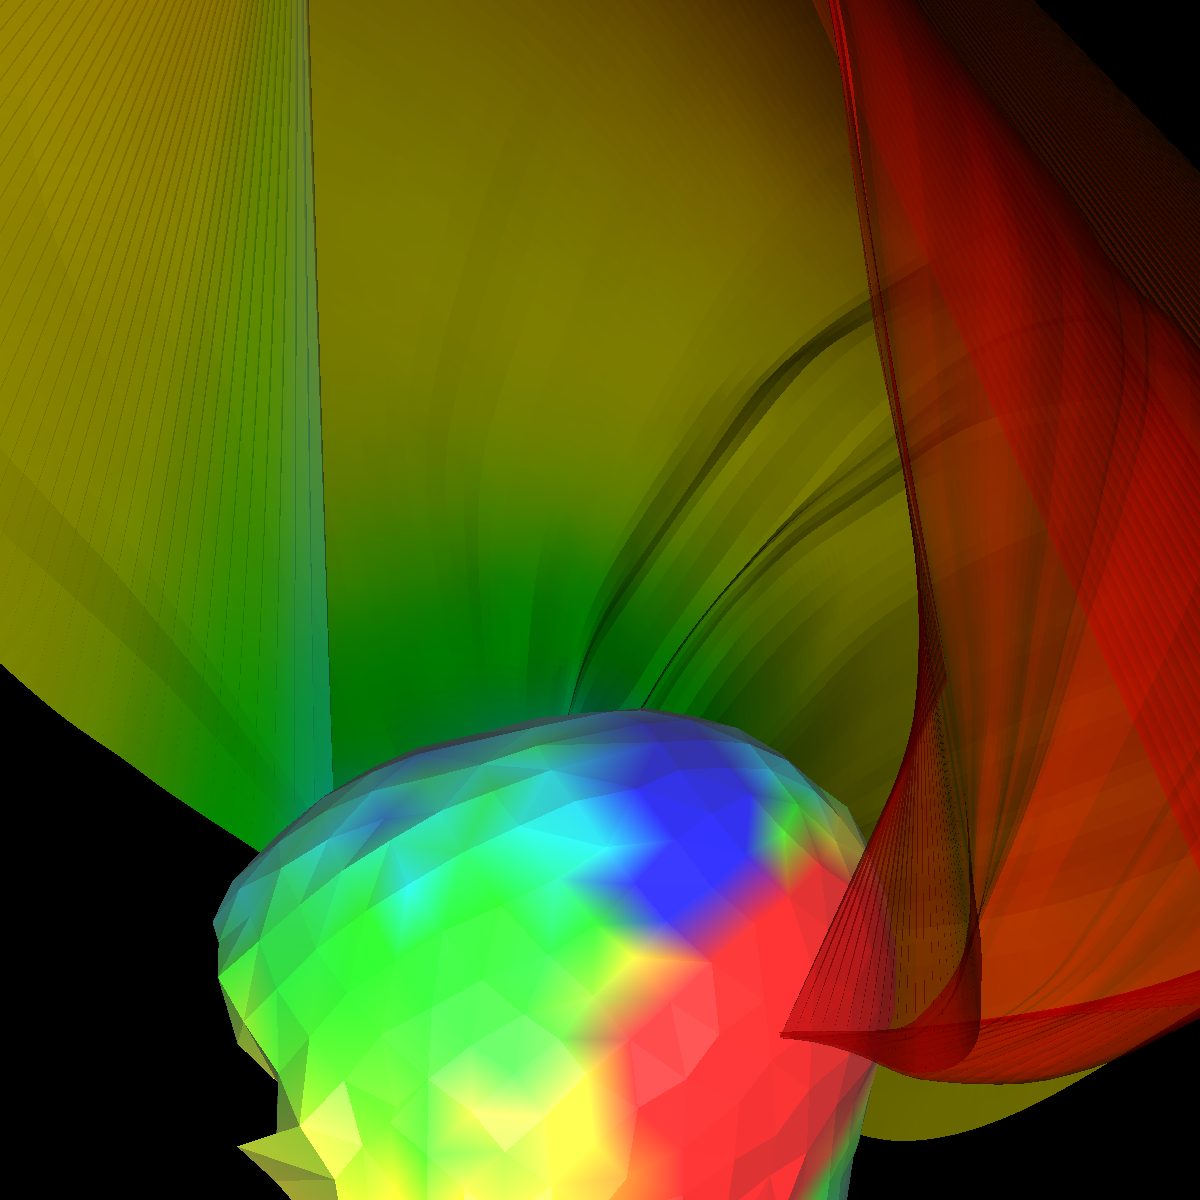
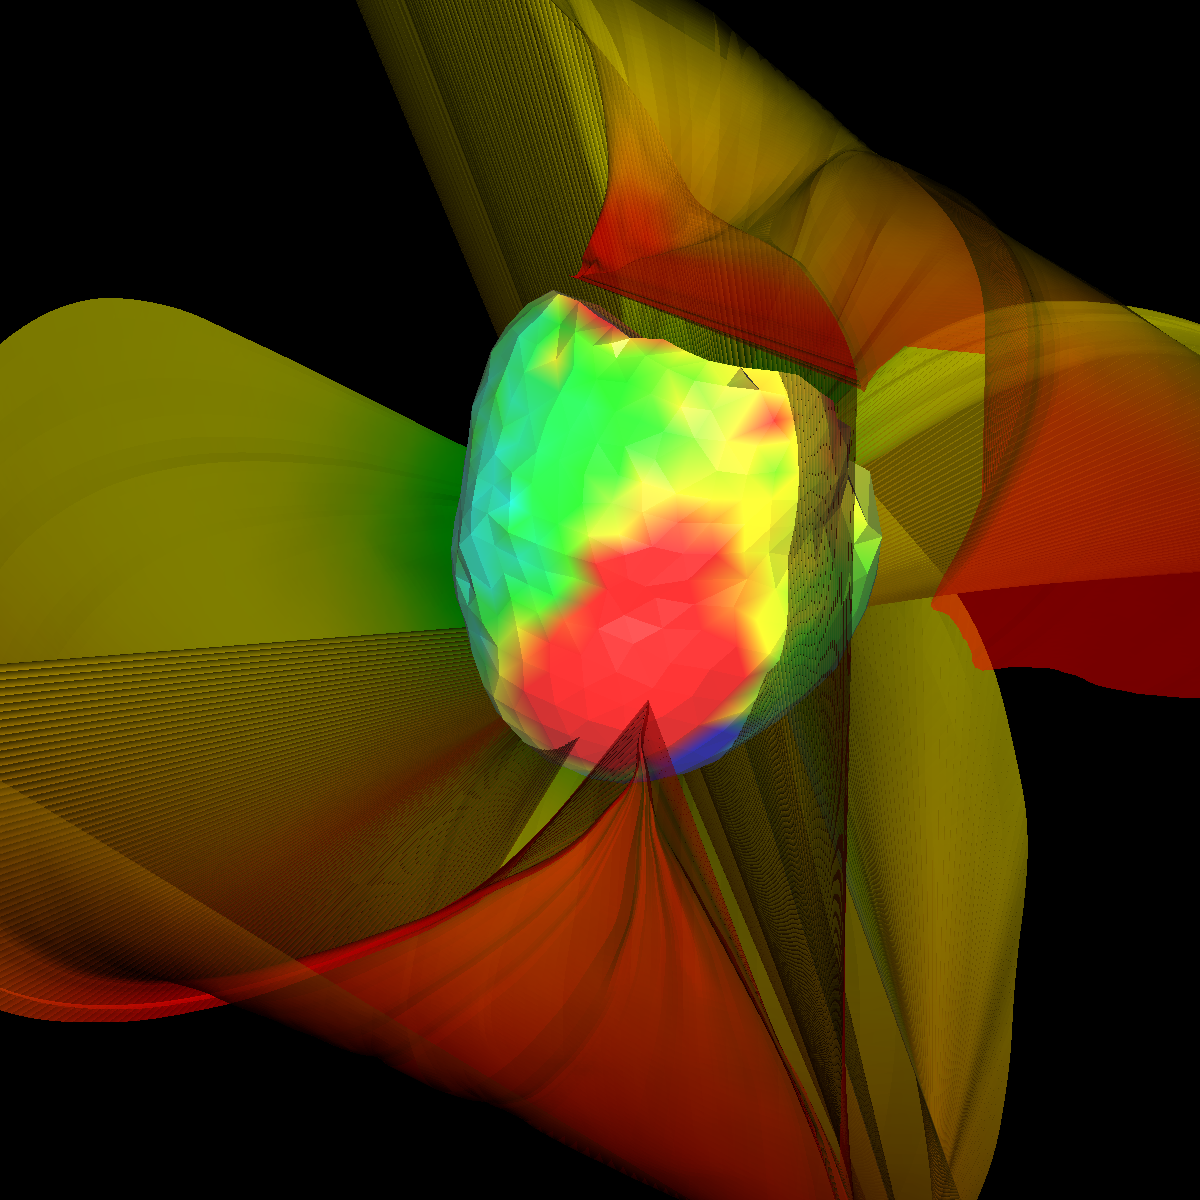
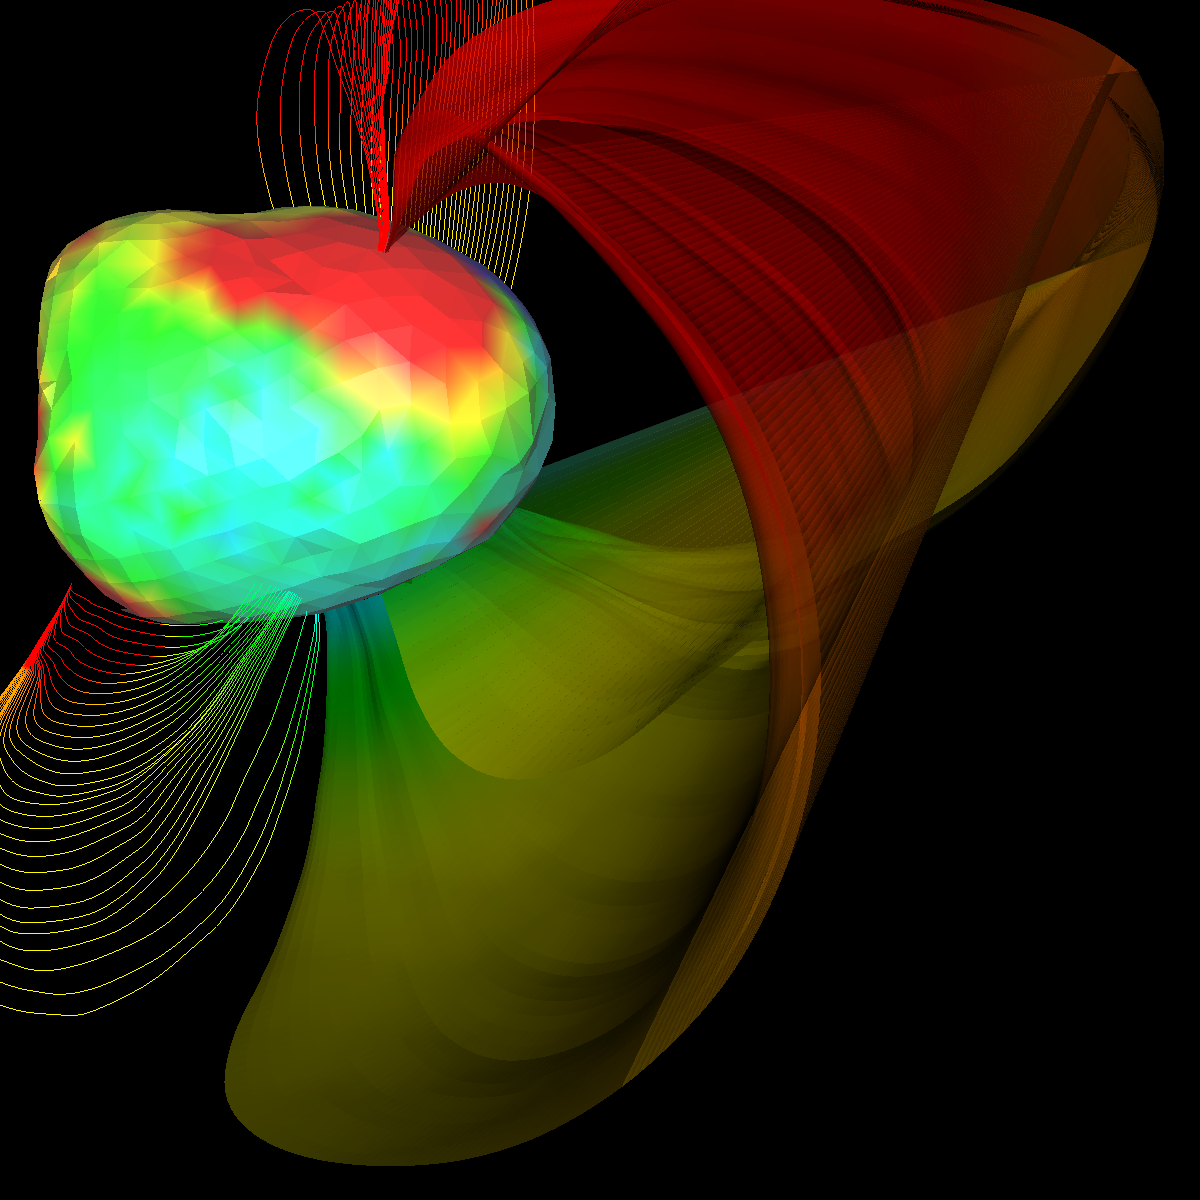
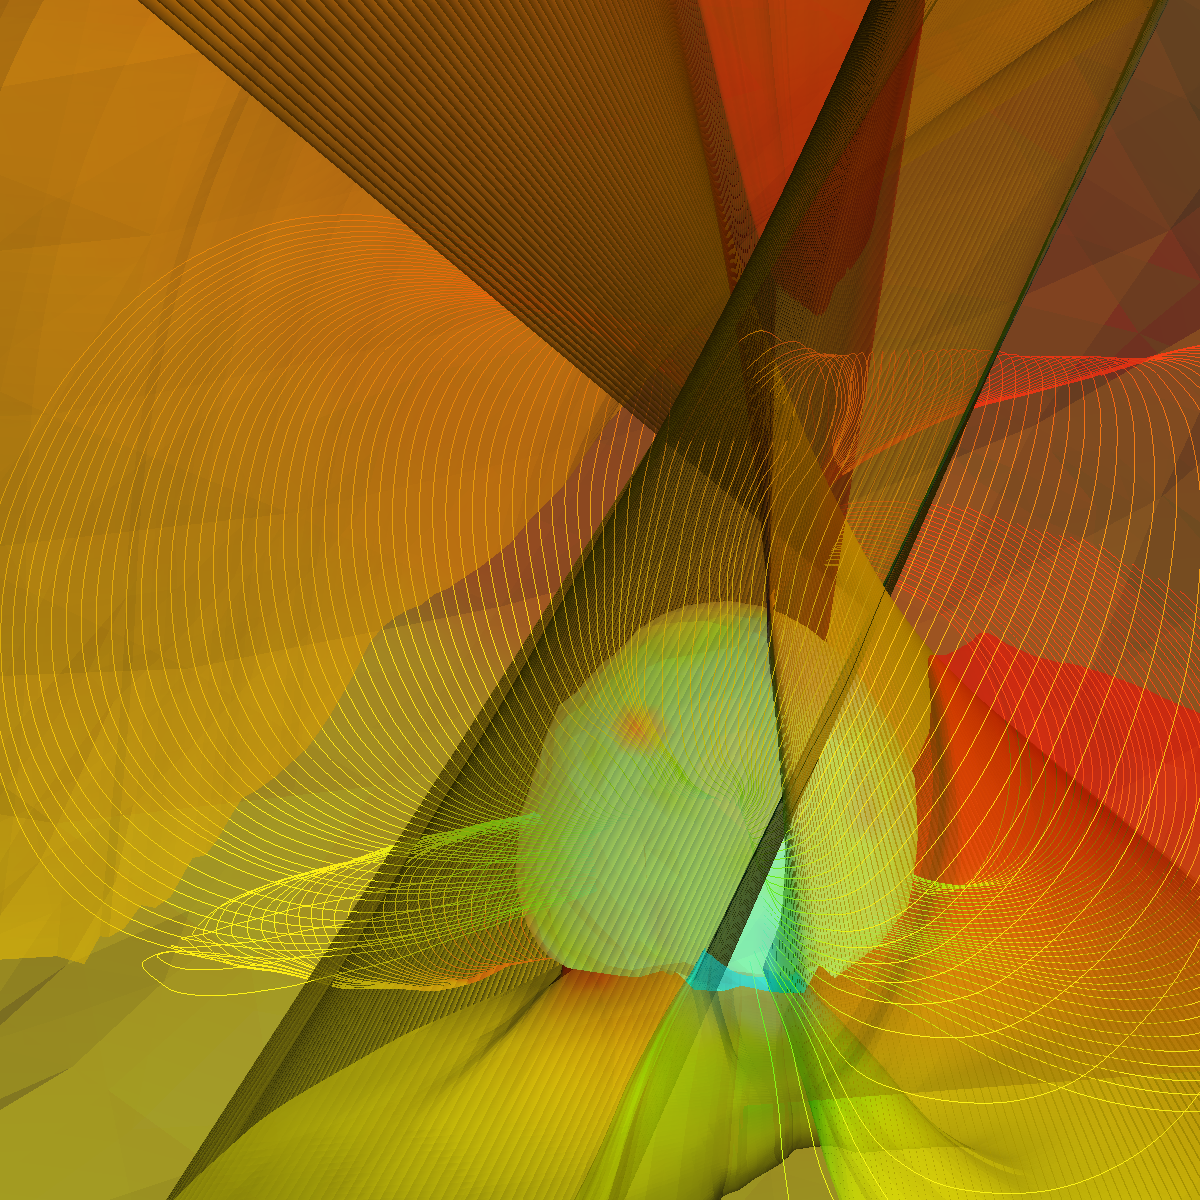
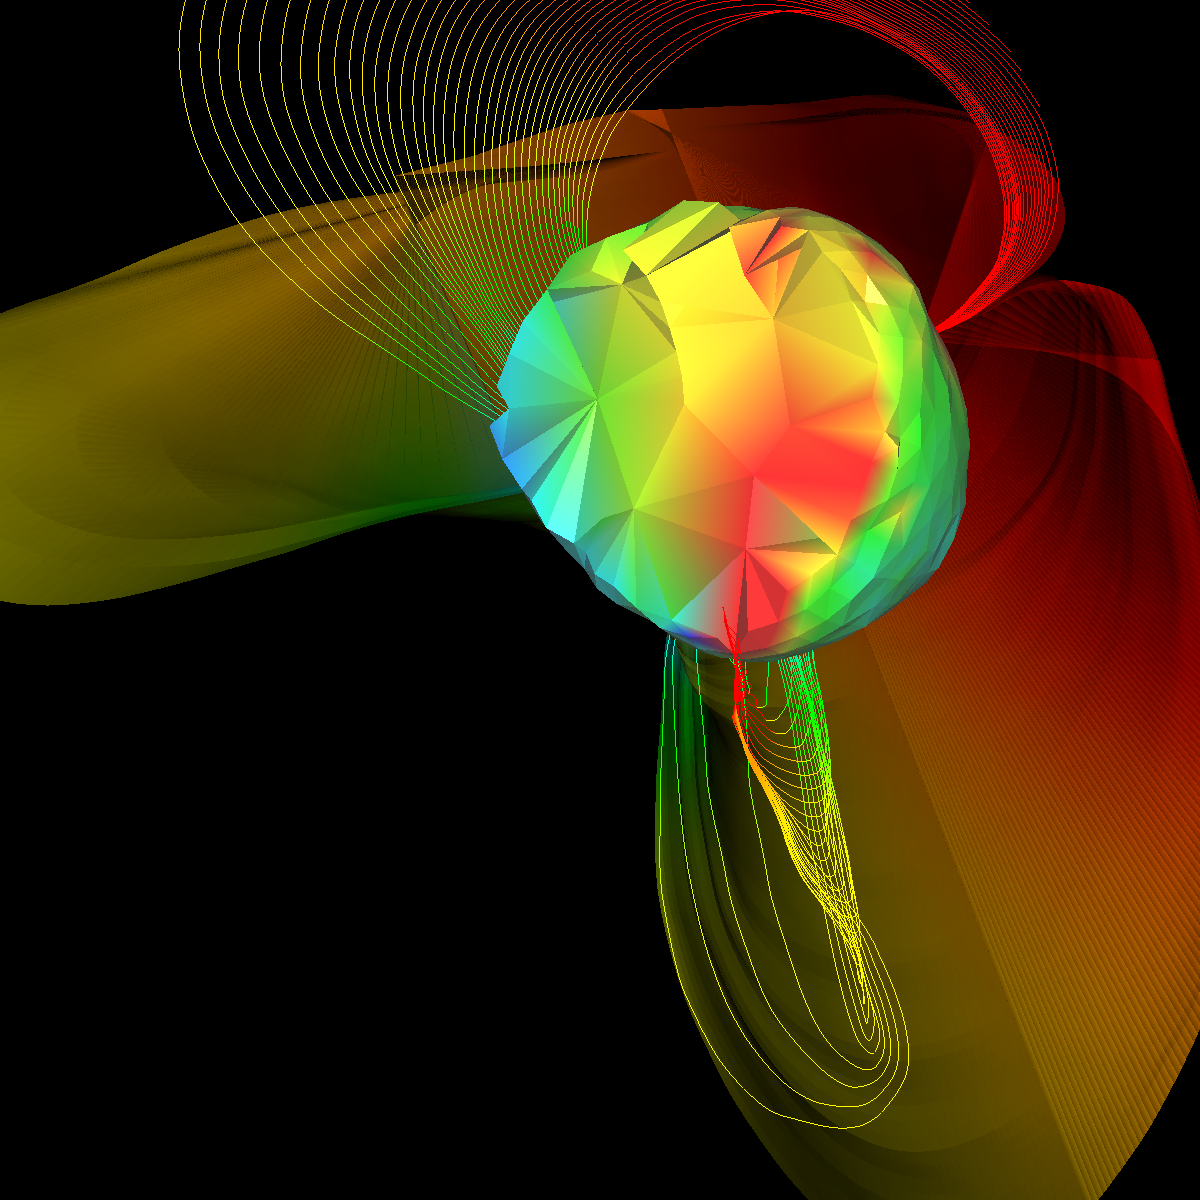
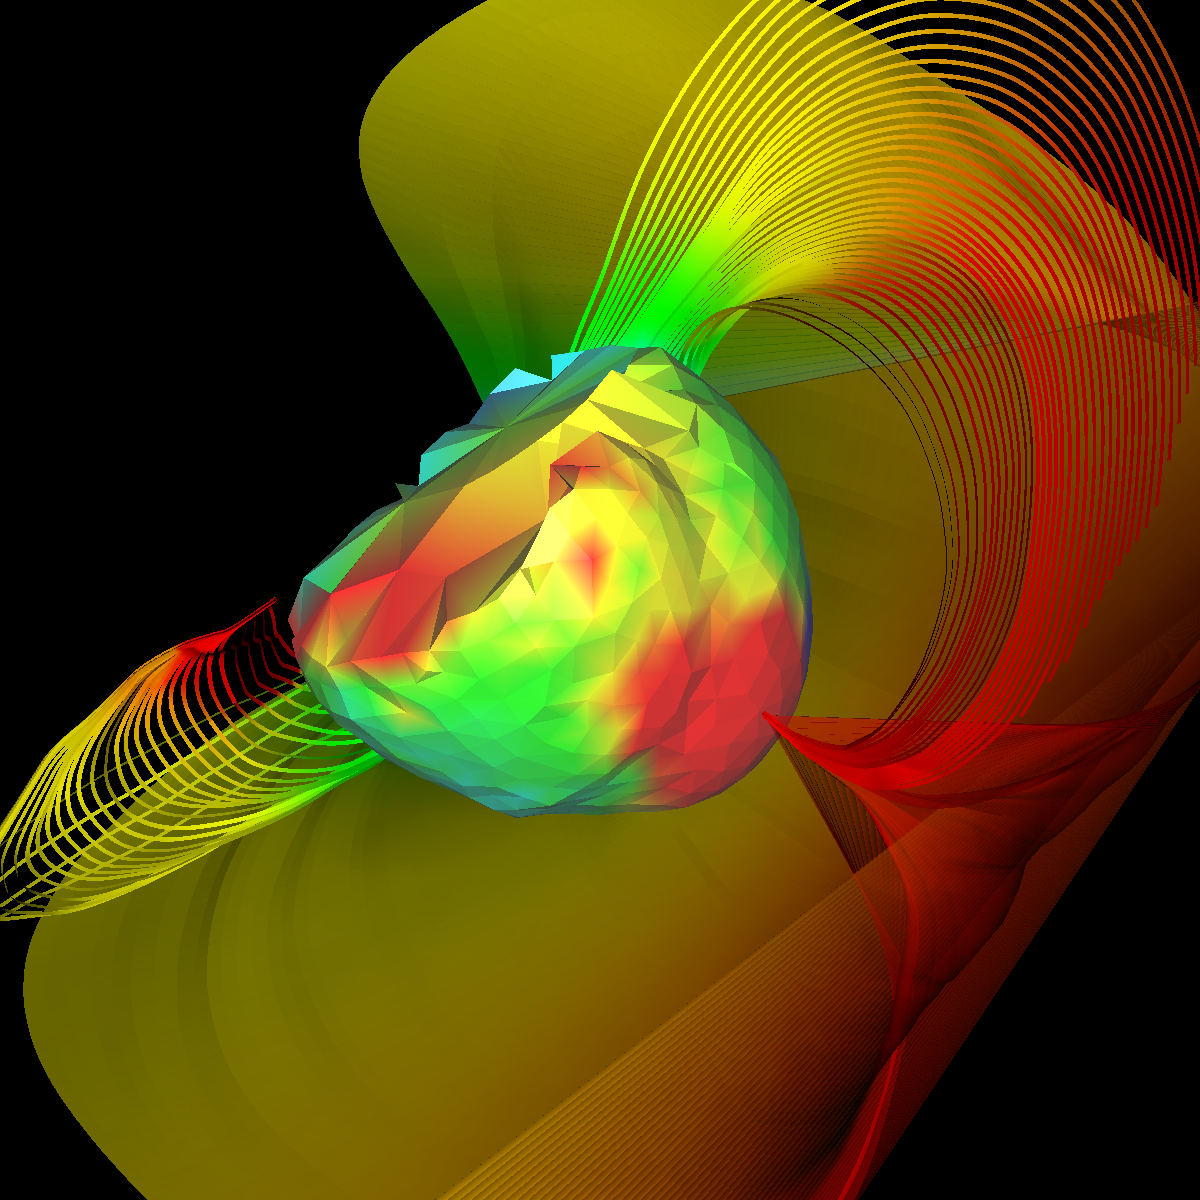
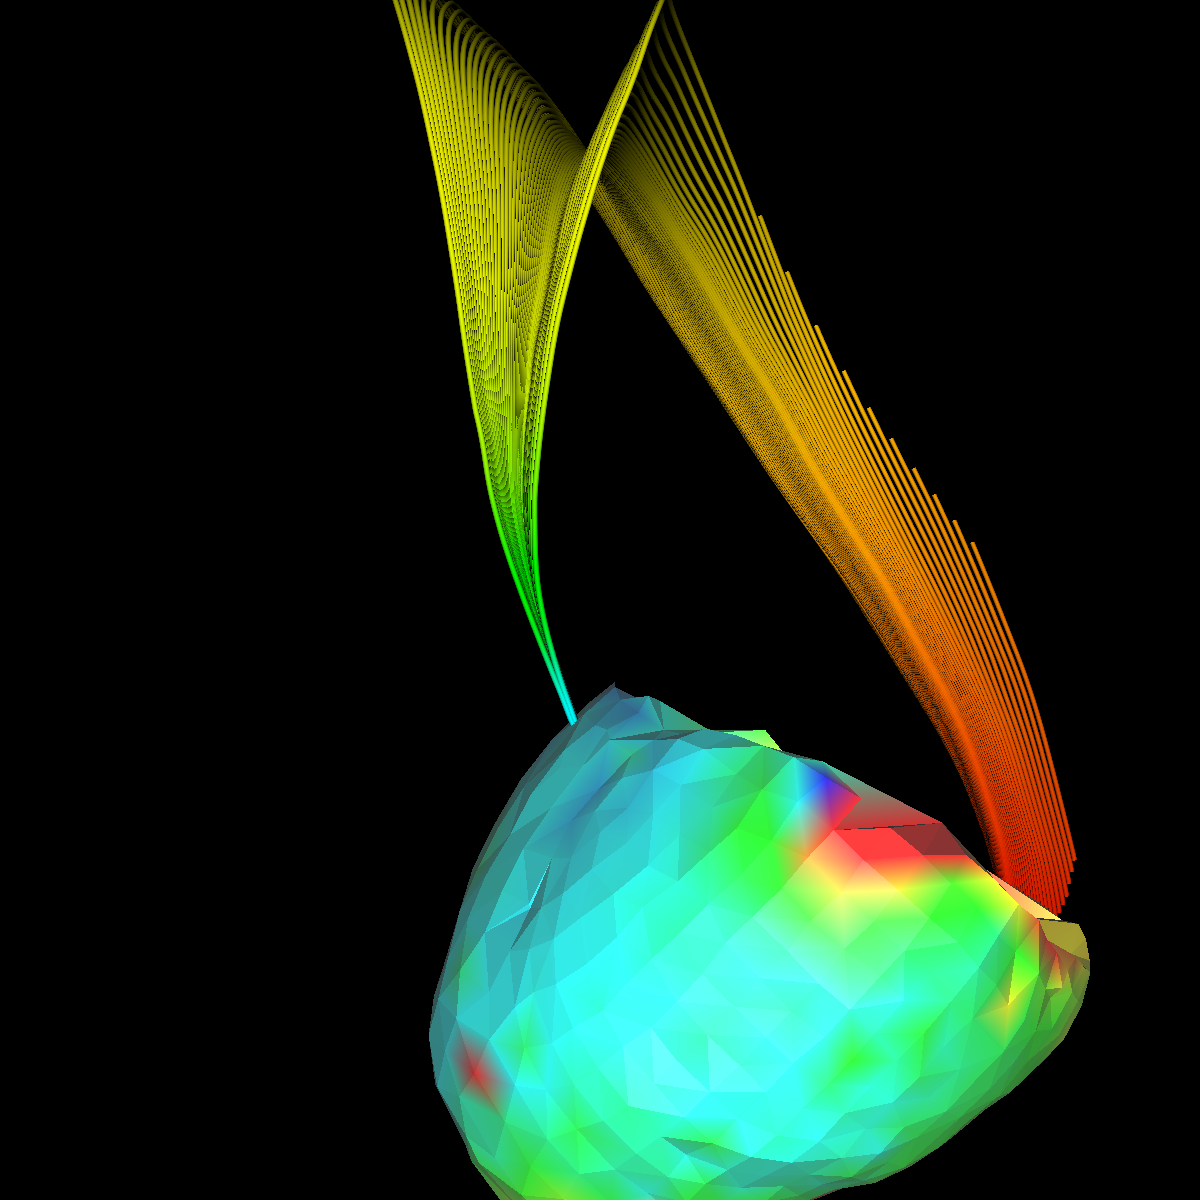
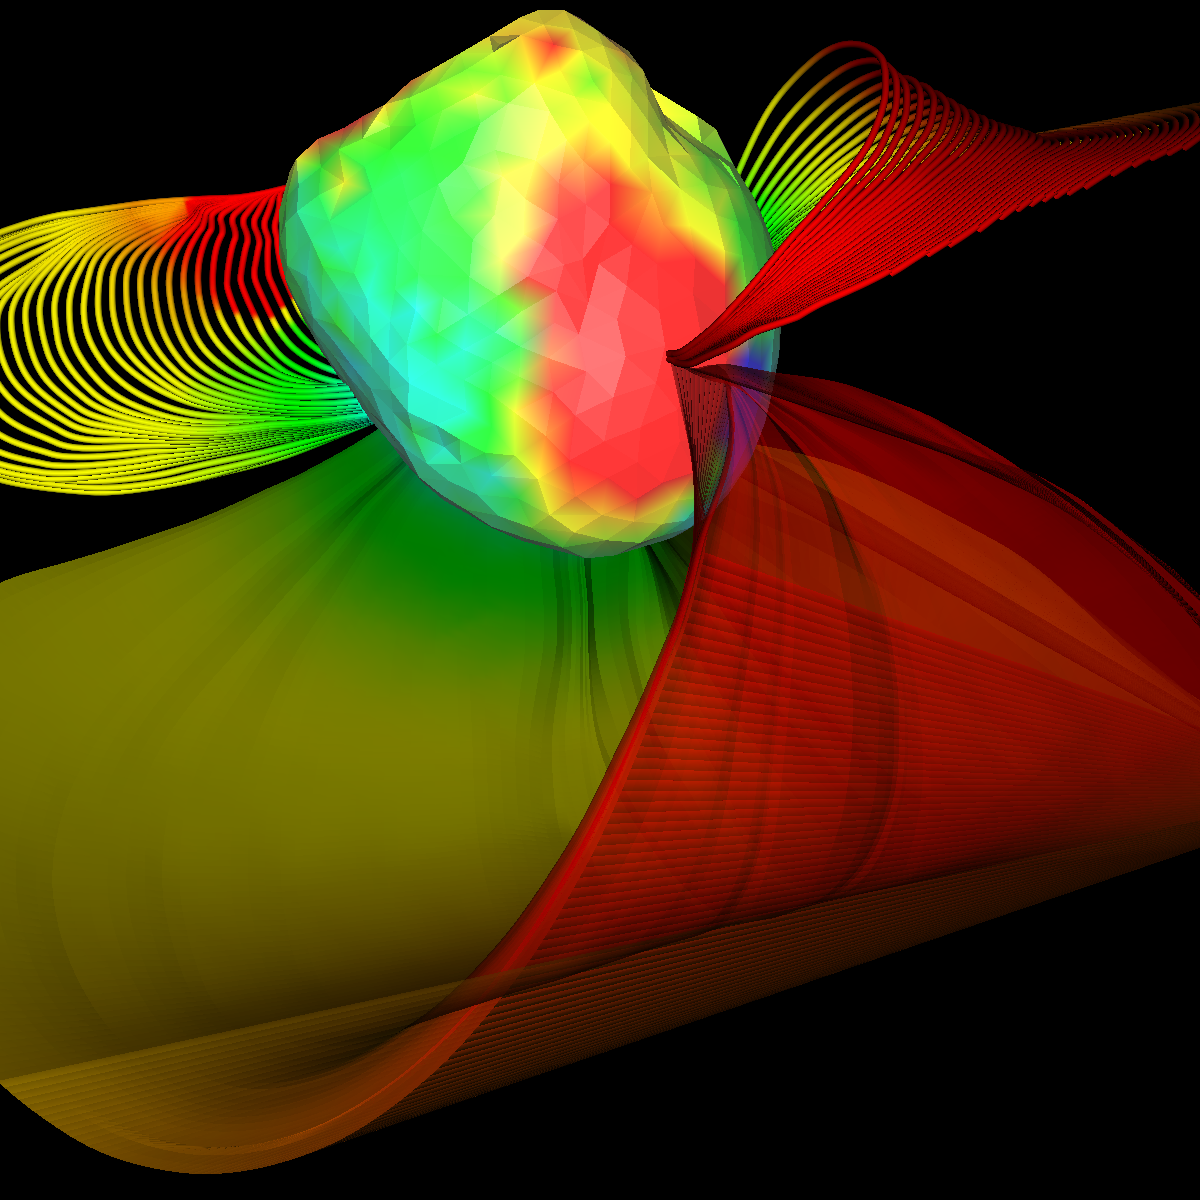
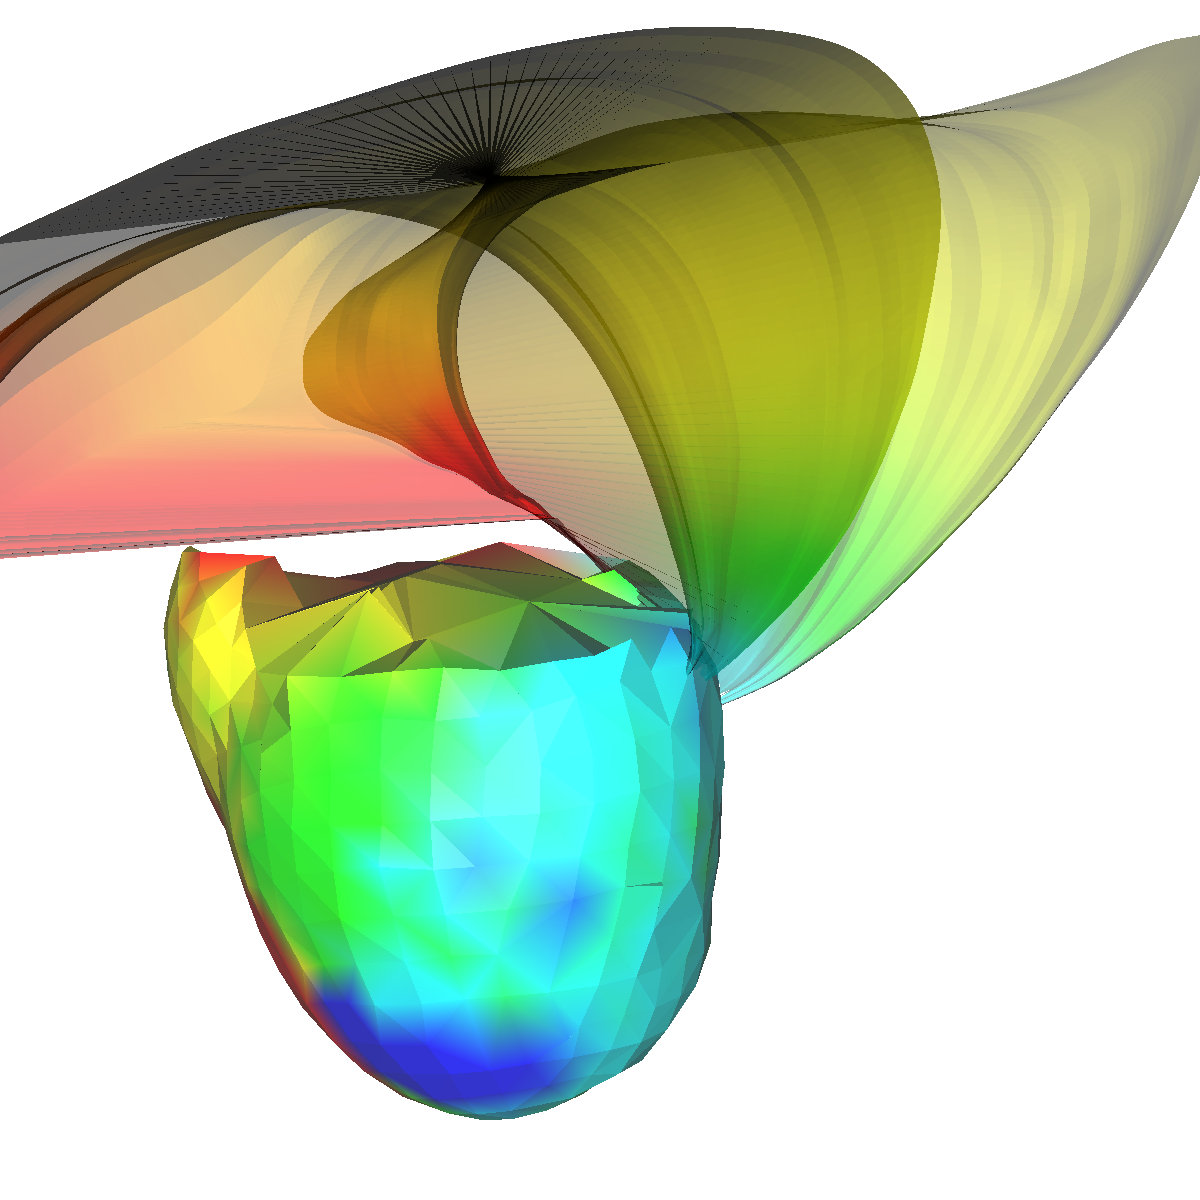
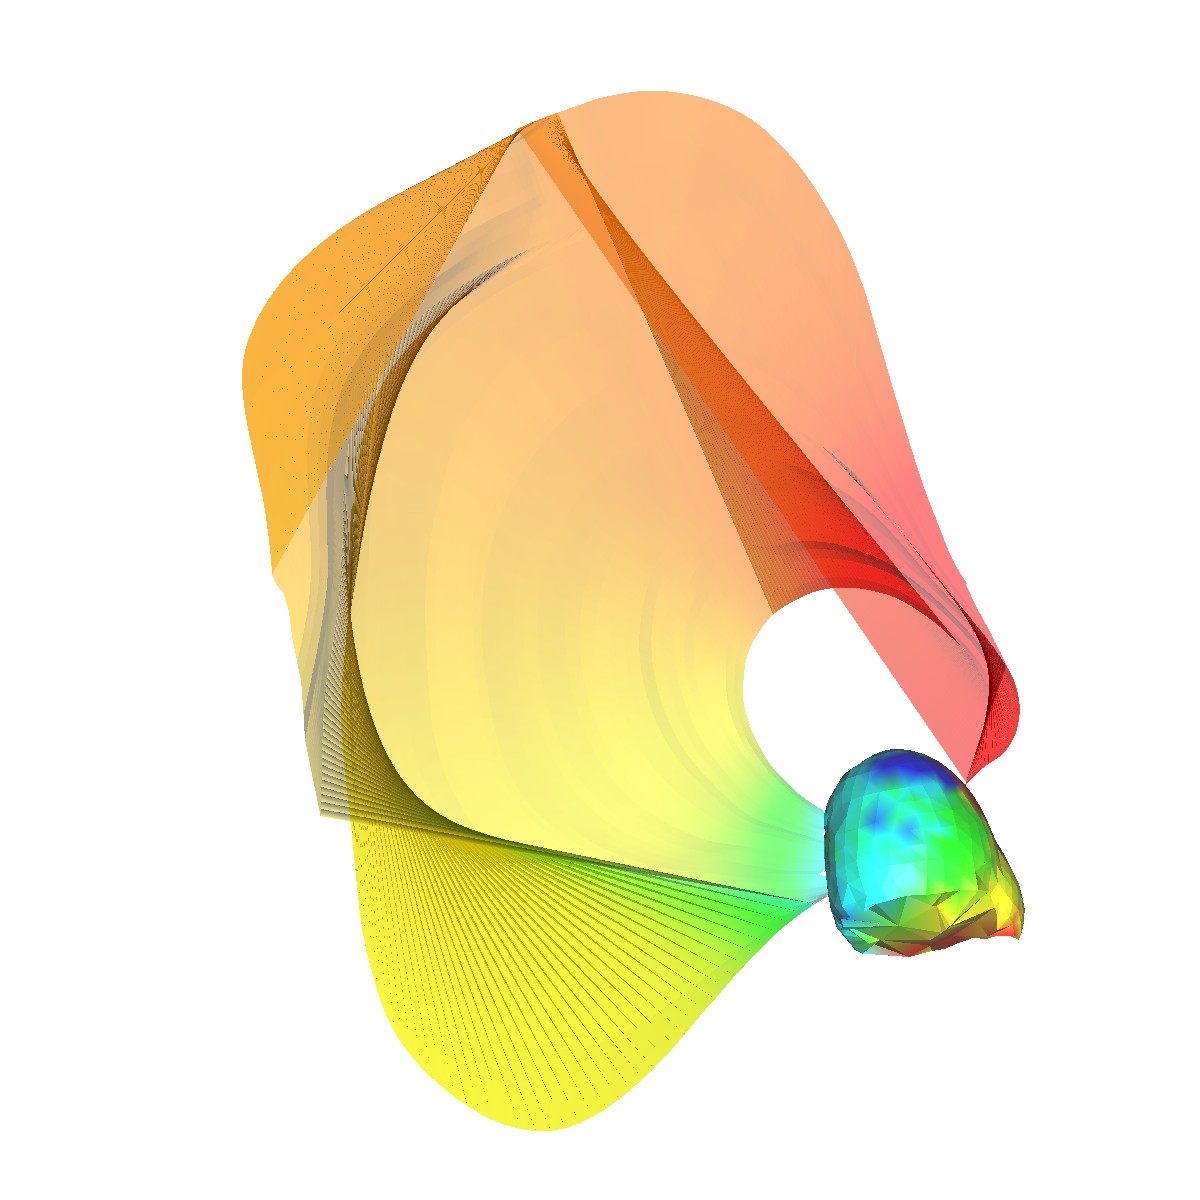
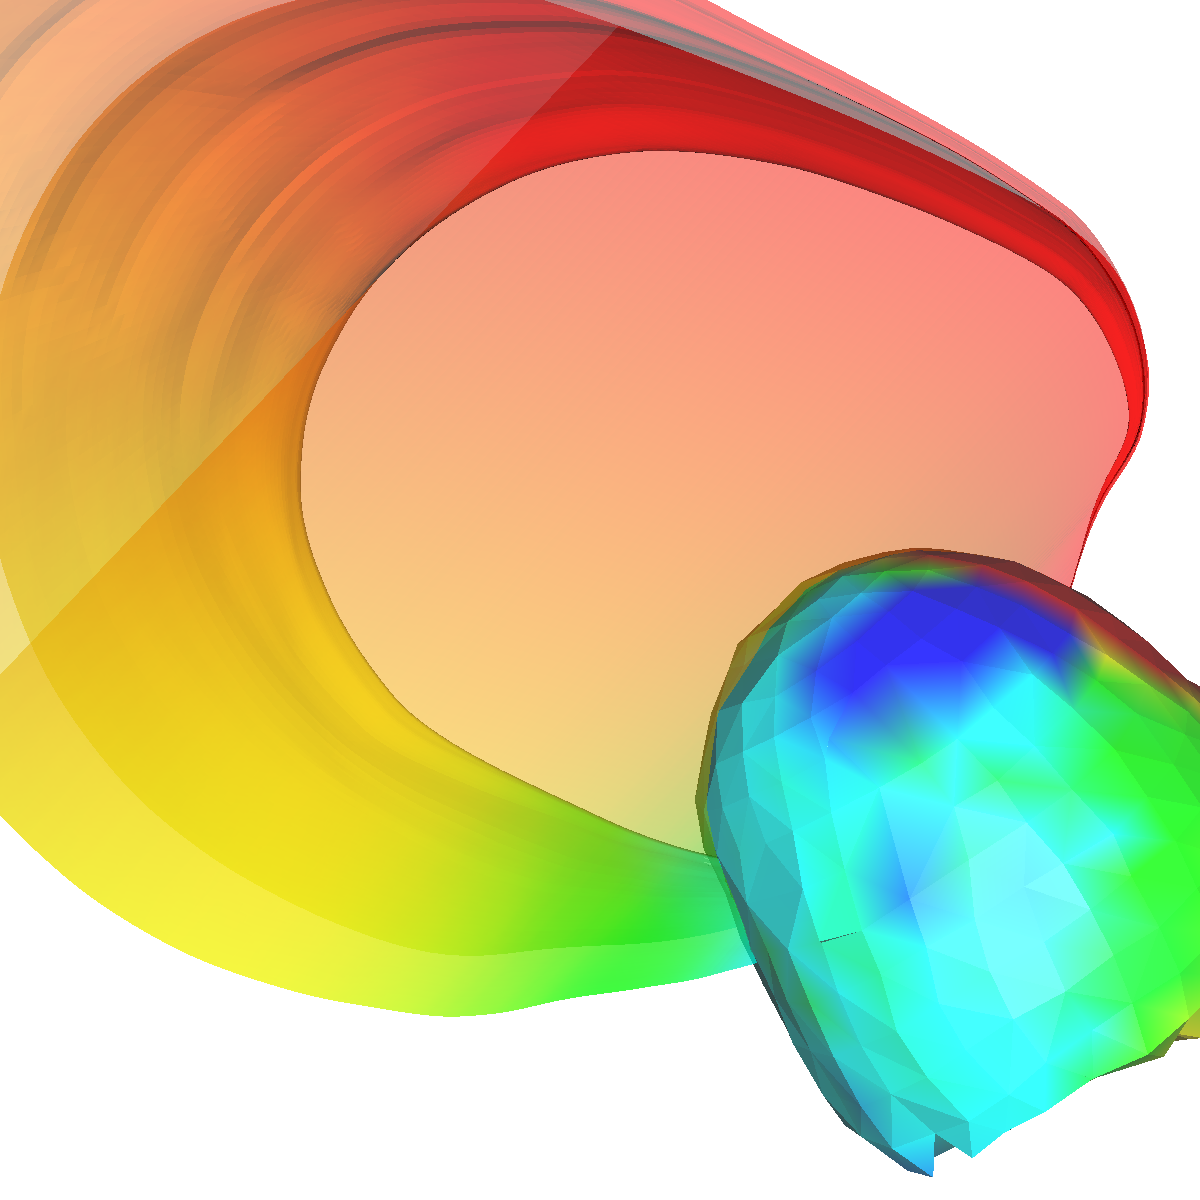
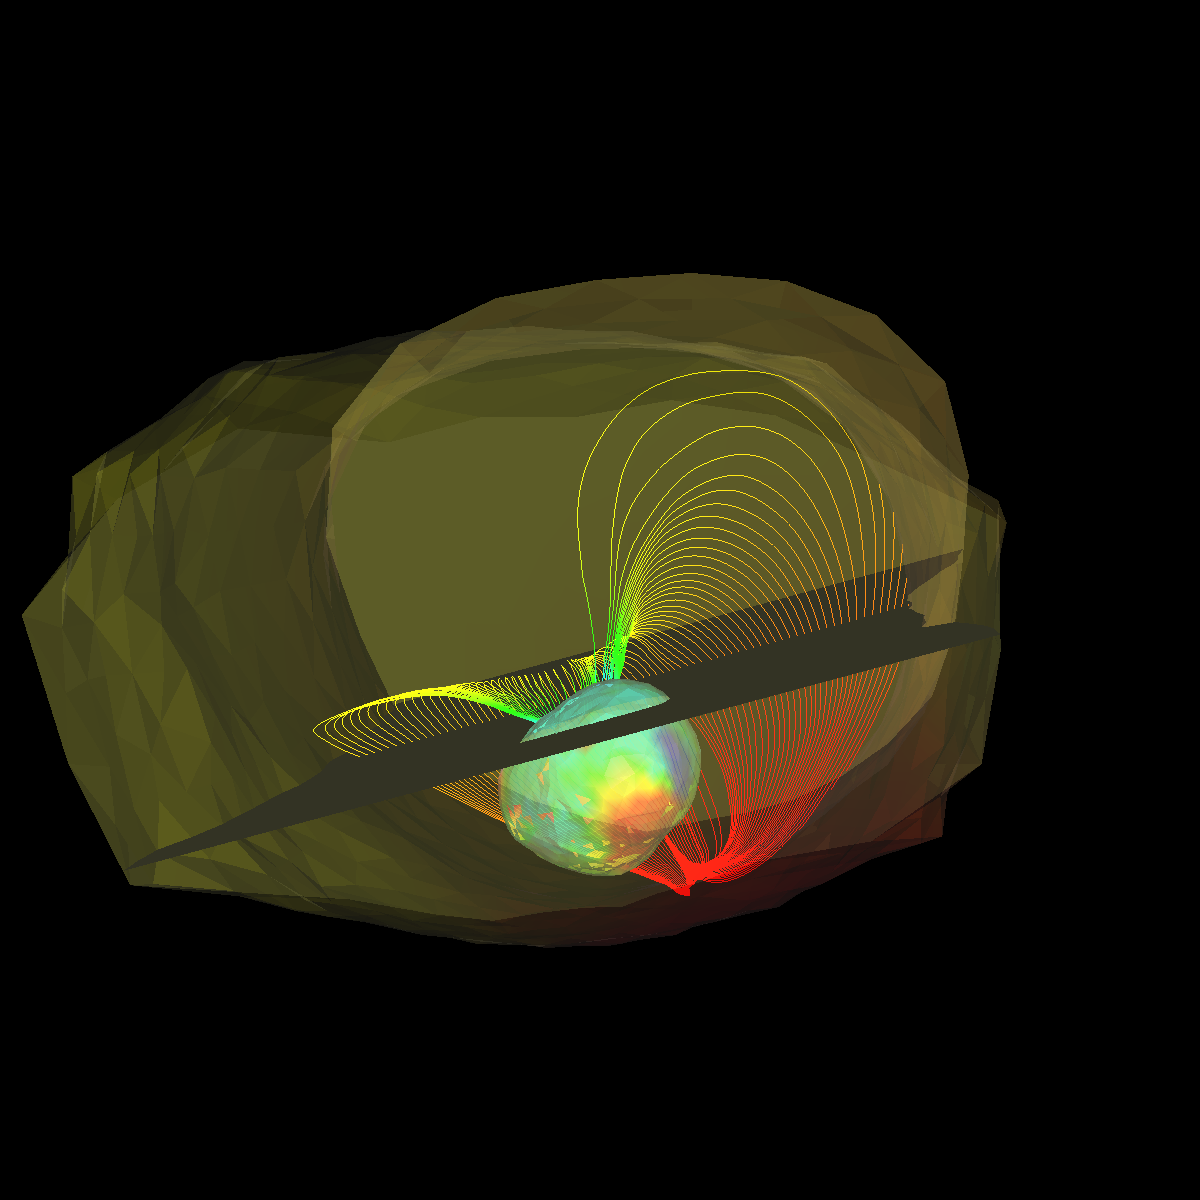
Part 1.2: Stream Surfaces In these renderings the bioelectric activity around the epicardium (outer tissue of the heart) are visualized using stream surfaces. More specifically, a stream surface is seeded directly below the heart at the previous location. We also seed two stream surfaces from below and above. In regards to features, both stream lines and stream surfaces provide very simiular features. However, the stream surfaces are preferred in the task of visualizing the bioelectric field around the heart since the surface provides more of a complete view. Interestingly, the stream surfaces seeded at these two locations are beginning to define what appears to be a topology directly on the epicardium. For instance, the red surface spans the most space as it becomes further from the heart but converges to what appears to be a single point as it approaches the epicardium. |
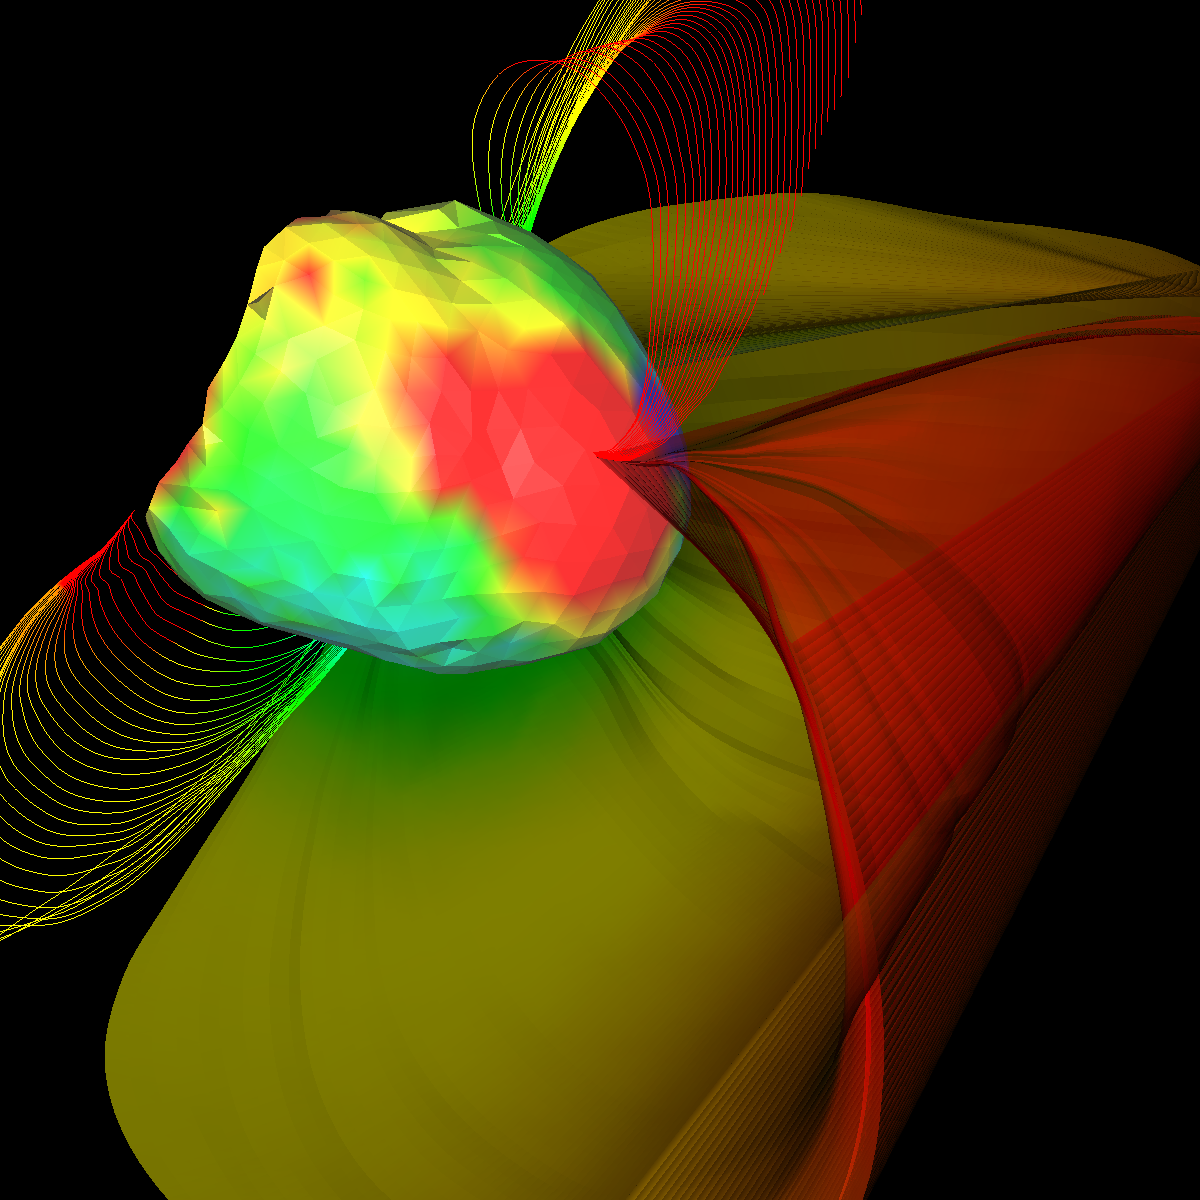
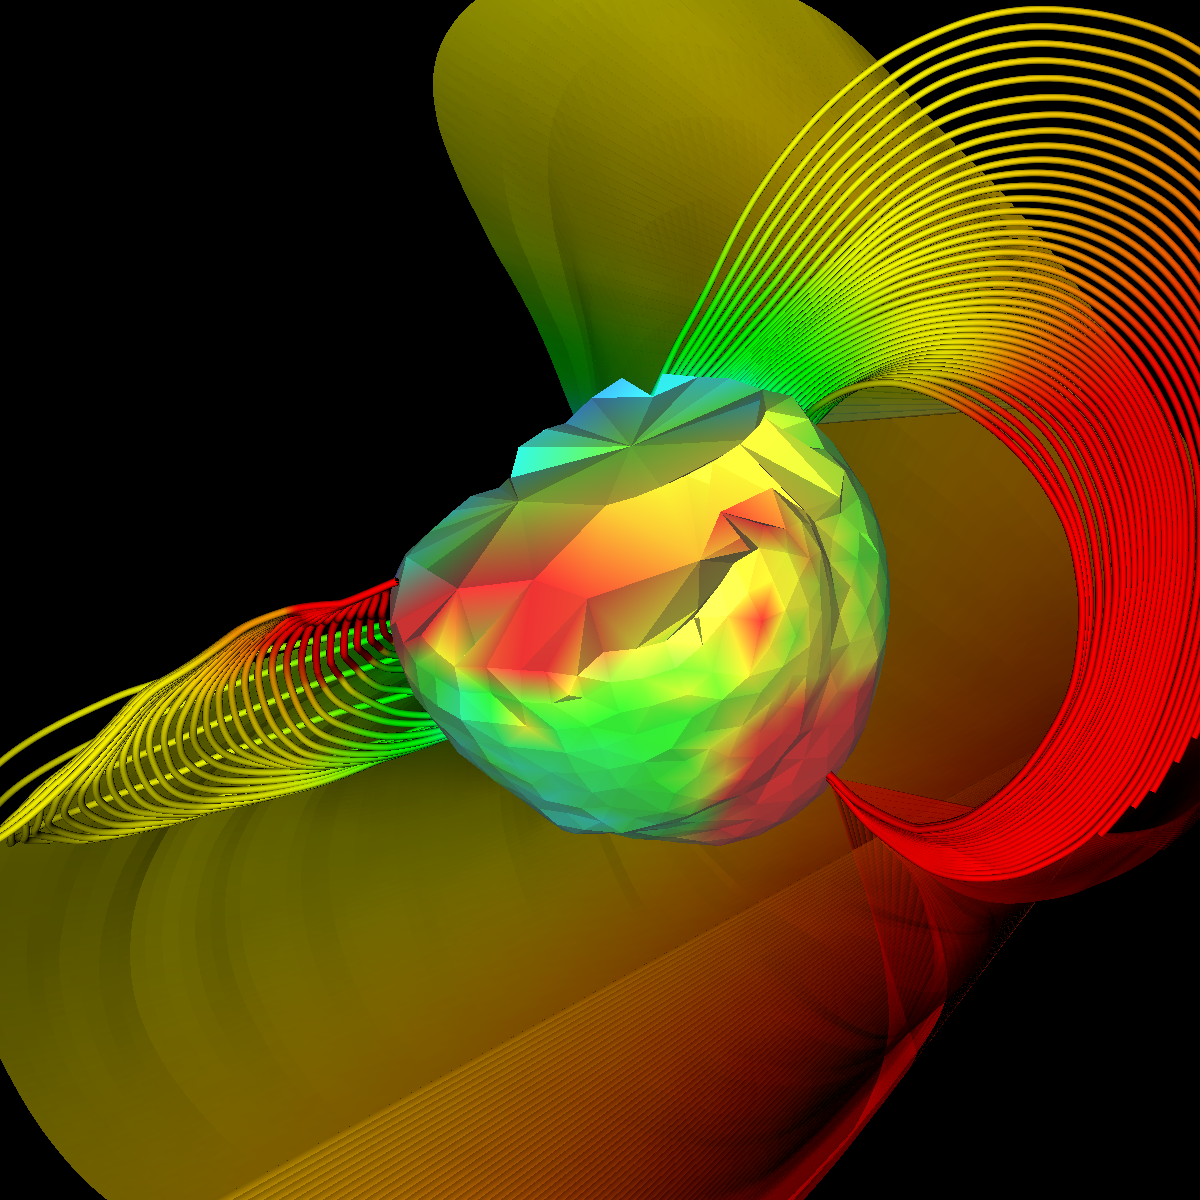
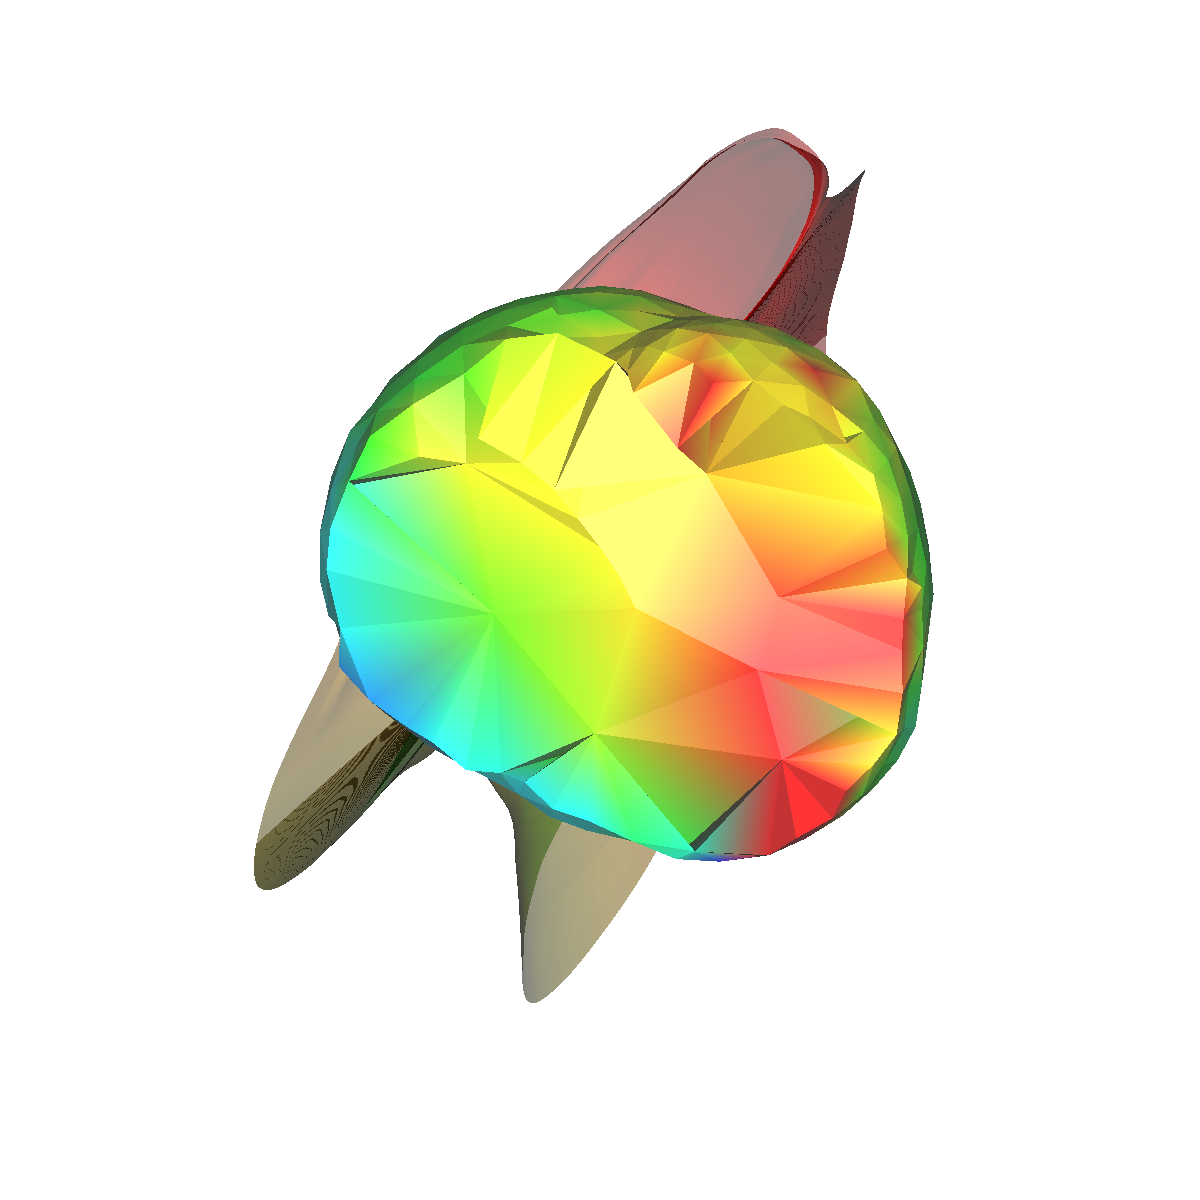
Part 1.3: Stream Lines and Surfaces In these renderings stream surfaces are applied along side stream-lines seeded at different positions. |
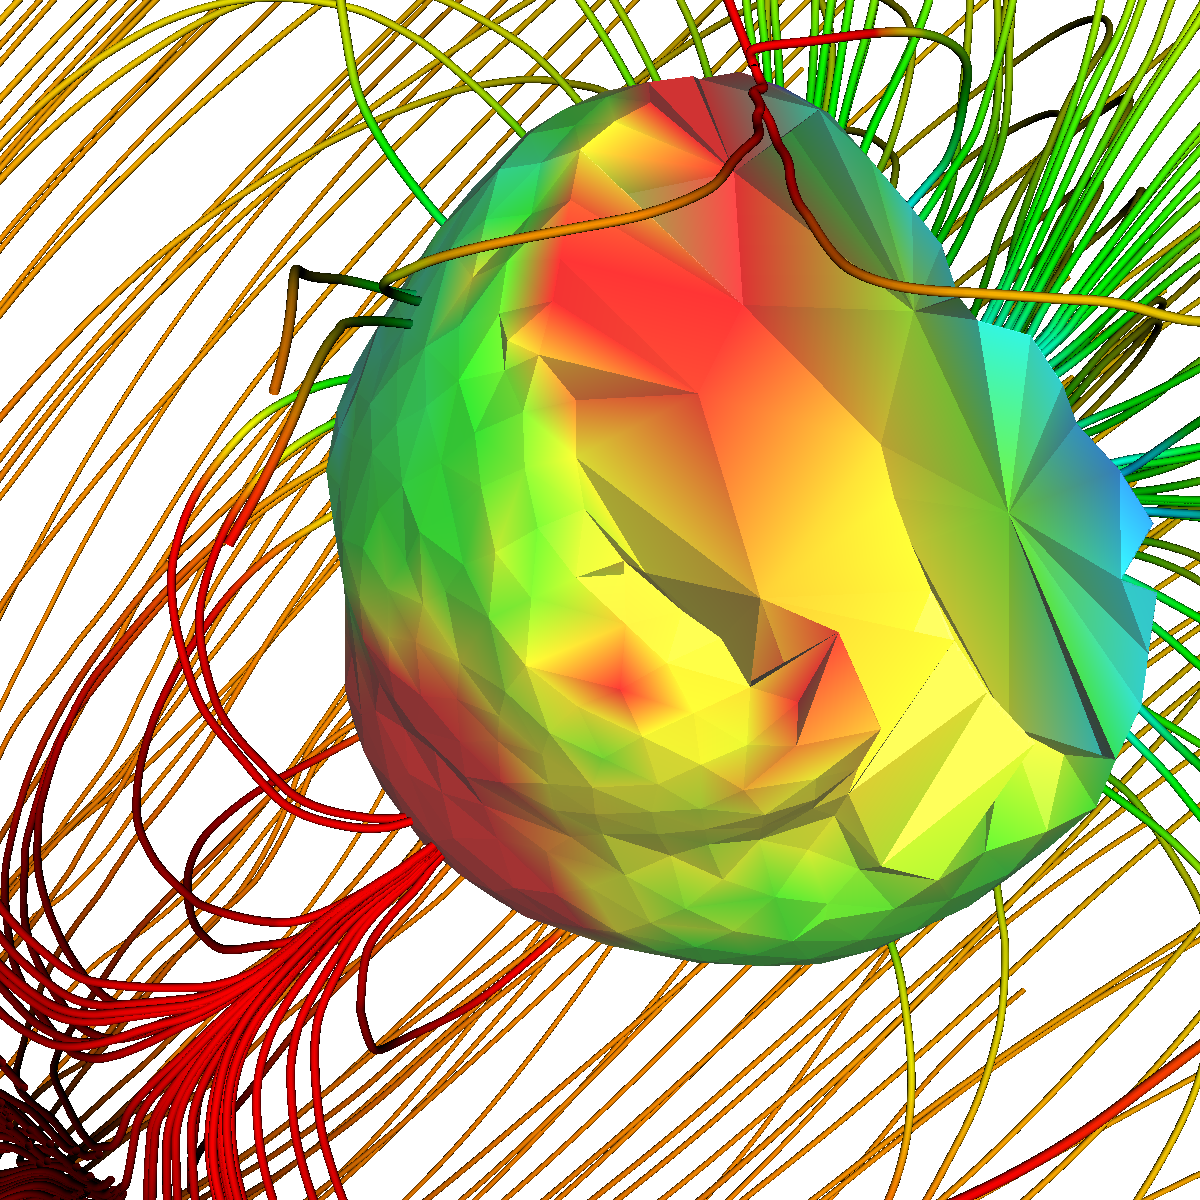
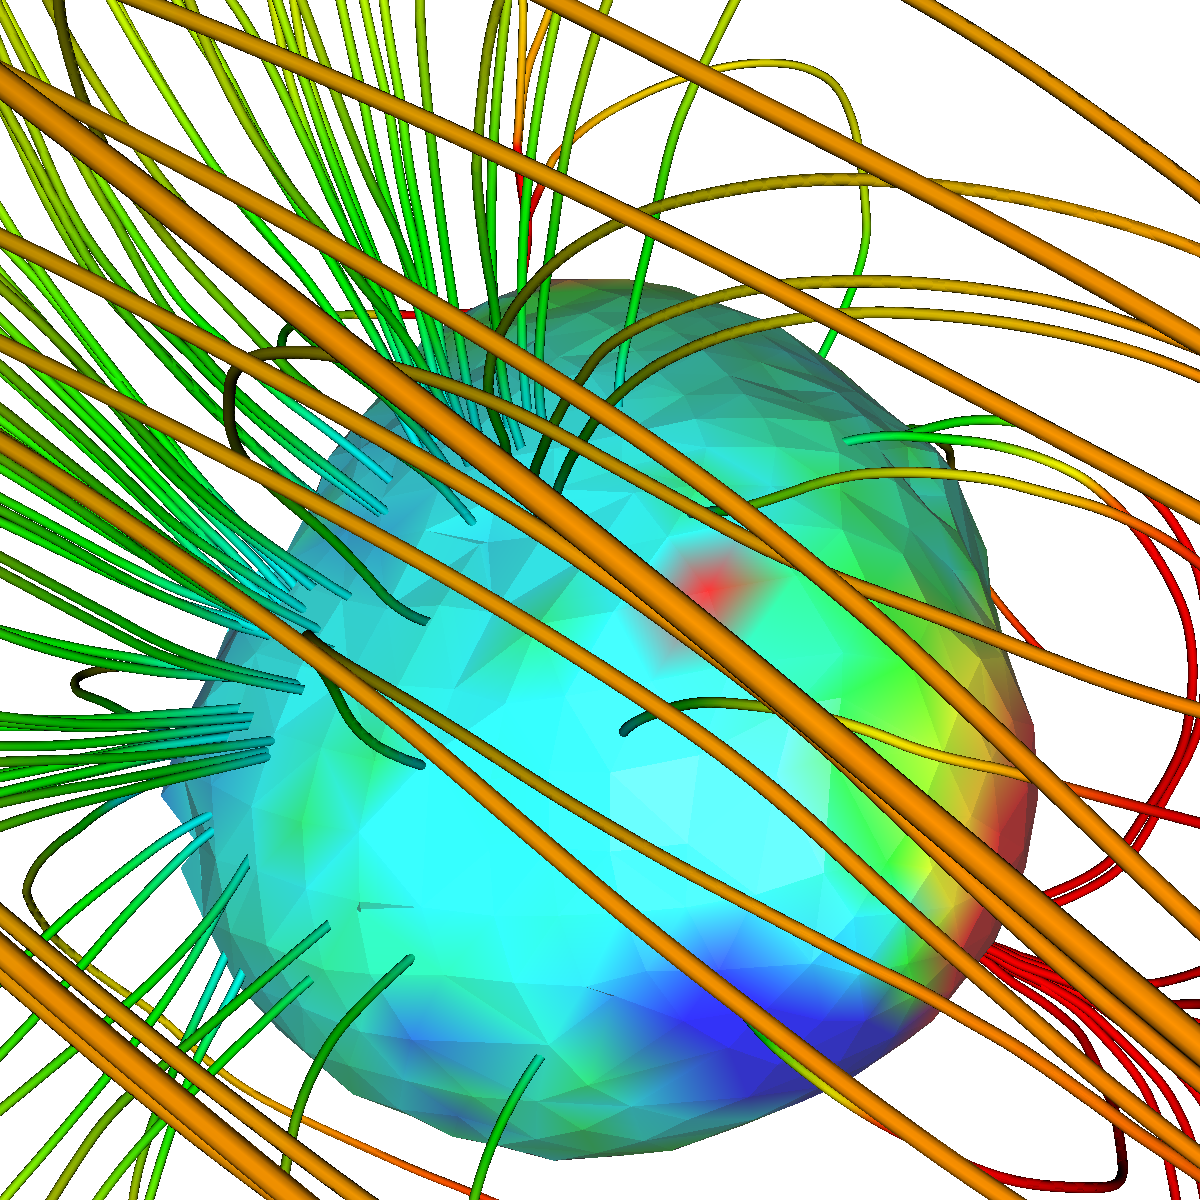
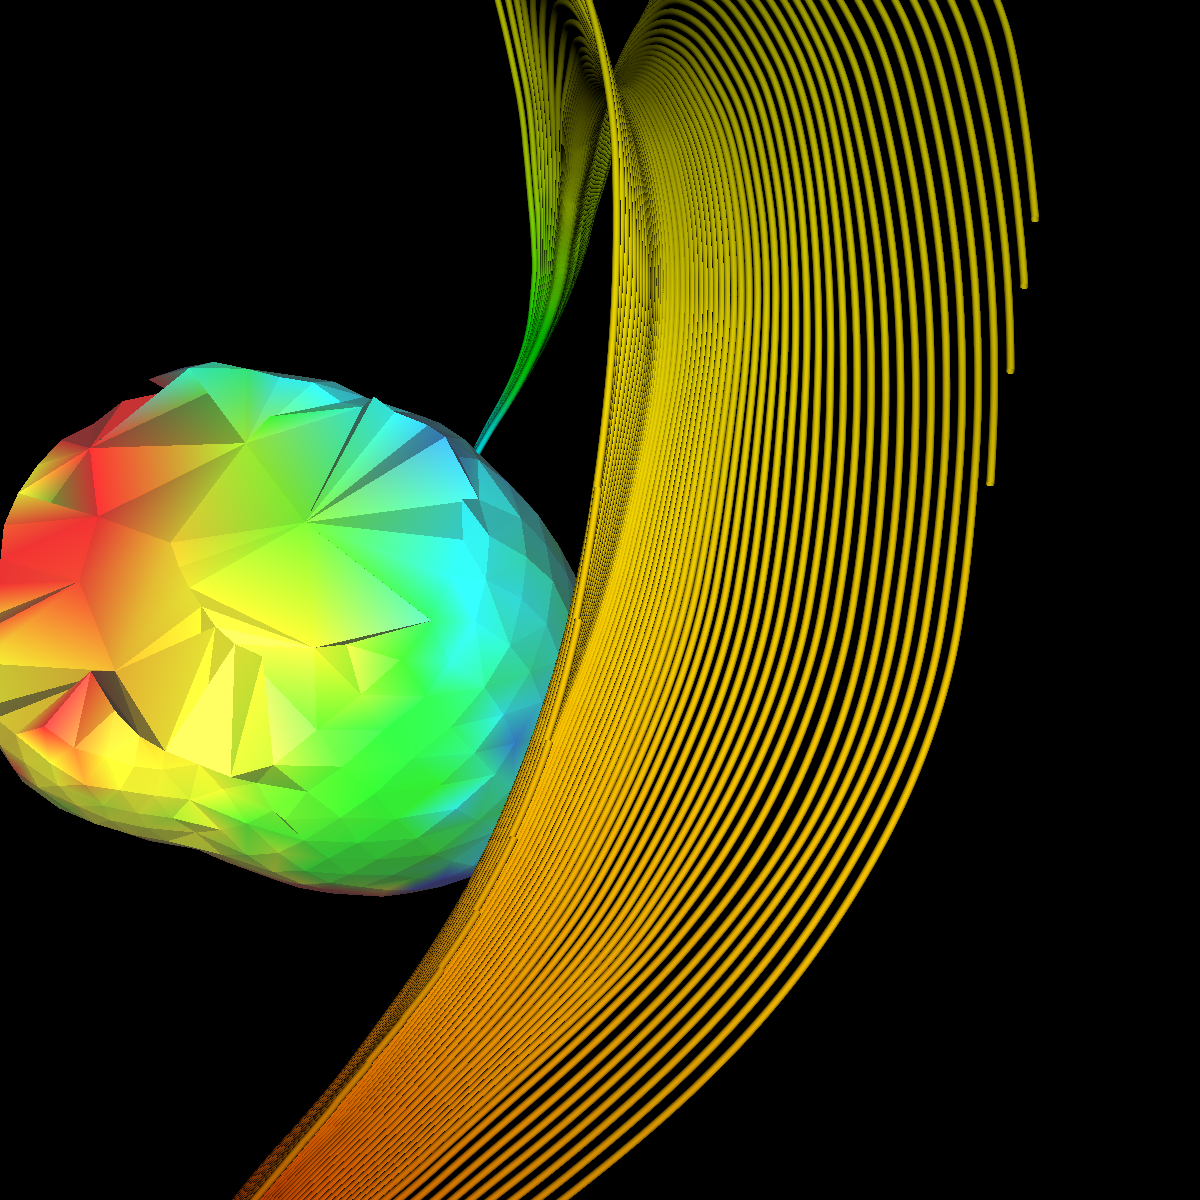
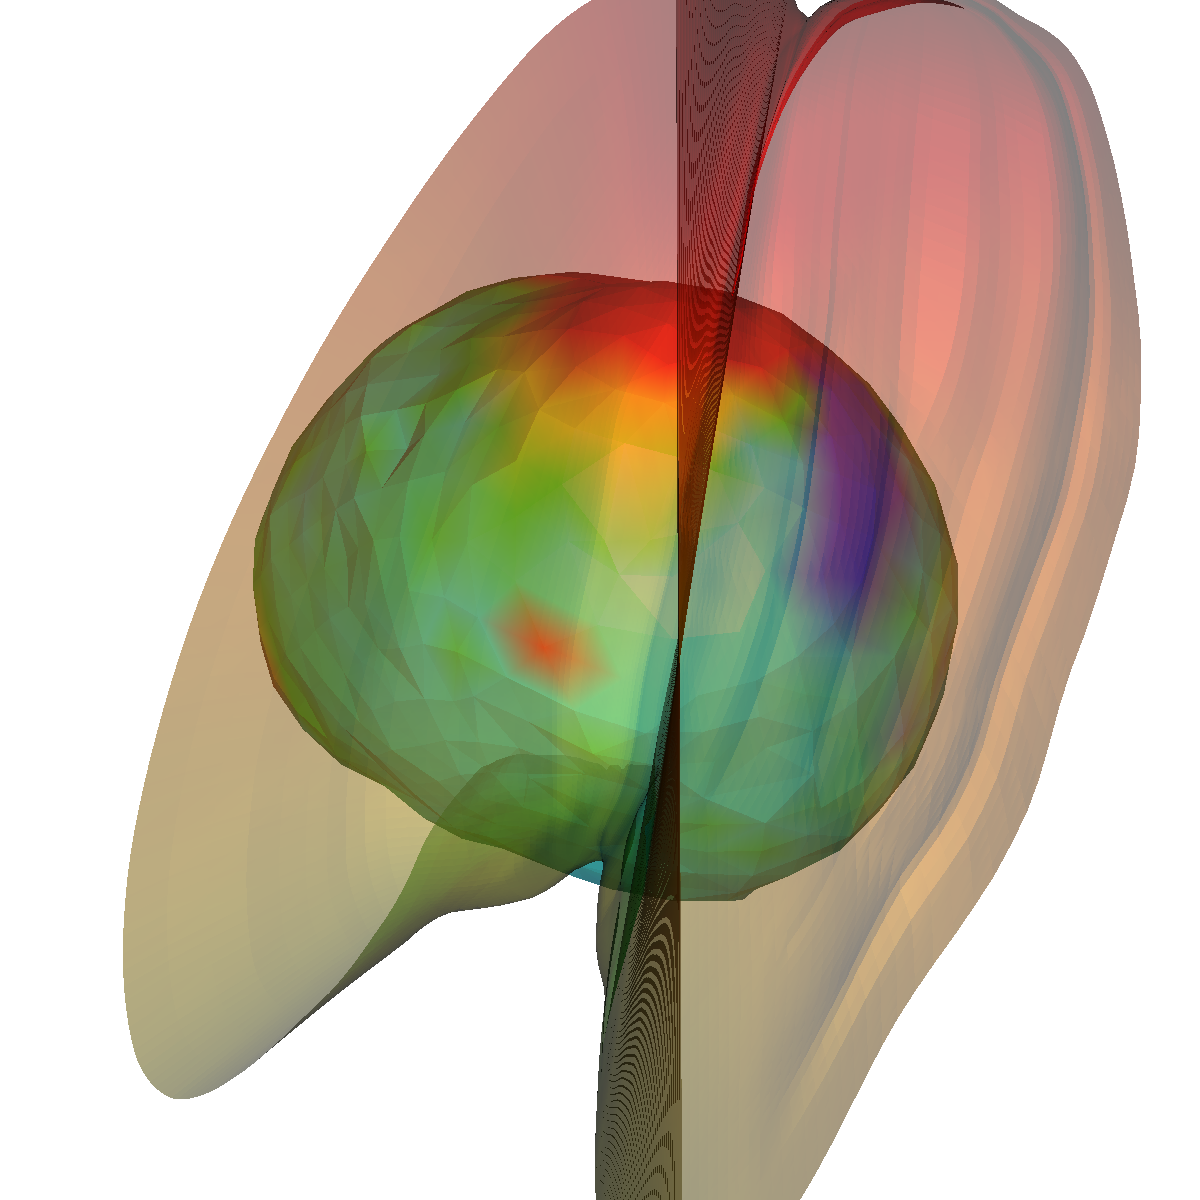
Part 1.4: Random Seeding for Global Features We randomly seed streamtubes within a raidus of 150 from the position (0 -6 192) which is just below the epicardium. The random seeding strategy captures a global perspective and highlights any anomalies with respect to the normal nature of the bioelectric field. Interestingly, this strategy captures unusual patterns around the top of the epicardium as shown in the renderings below. |
Part 1.5: Stream Ribbons We apply stream ribbons in an attempt to capture the directionality of the bioelectric flow around the epicardium. The baseline seed locations are used to generate the stream ribbons. The stream ribbons visualize the directionality or spiraling nature of the flow better than streamlines or tubes. Additionally, the stream ribbons could provide insight into the type of critical points for each region of the epicardium where the streamlines converge. |
Part 1.6: Stream Tubes and Surfaces Stream tubes and surfaces are applied to capture other related features. The stream tubes and surfaces are seeded at various locations. |
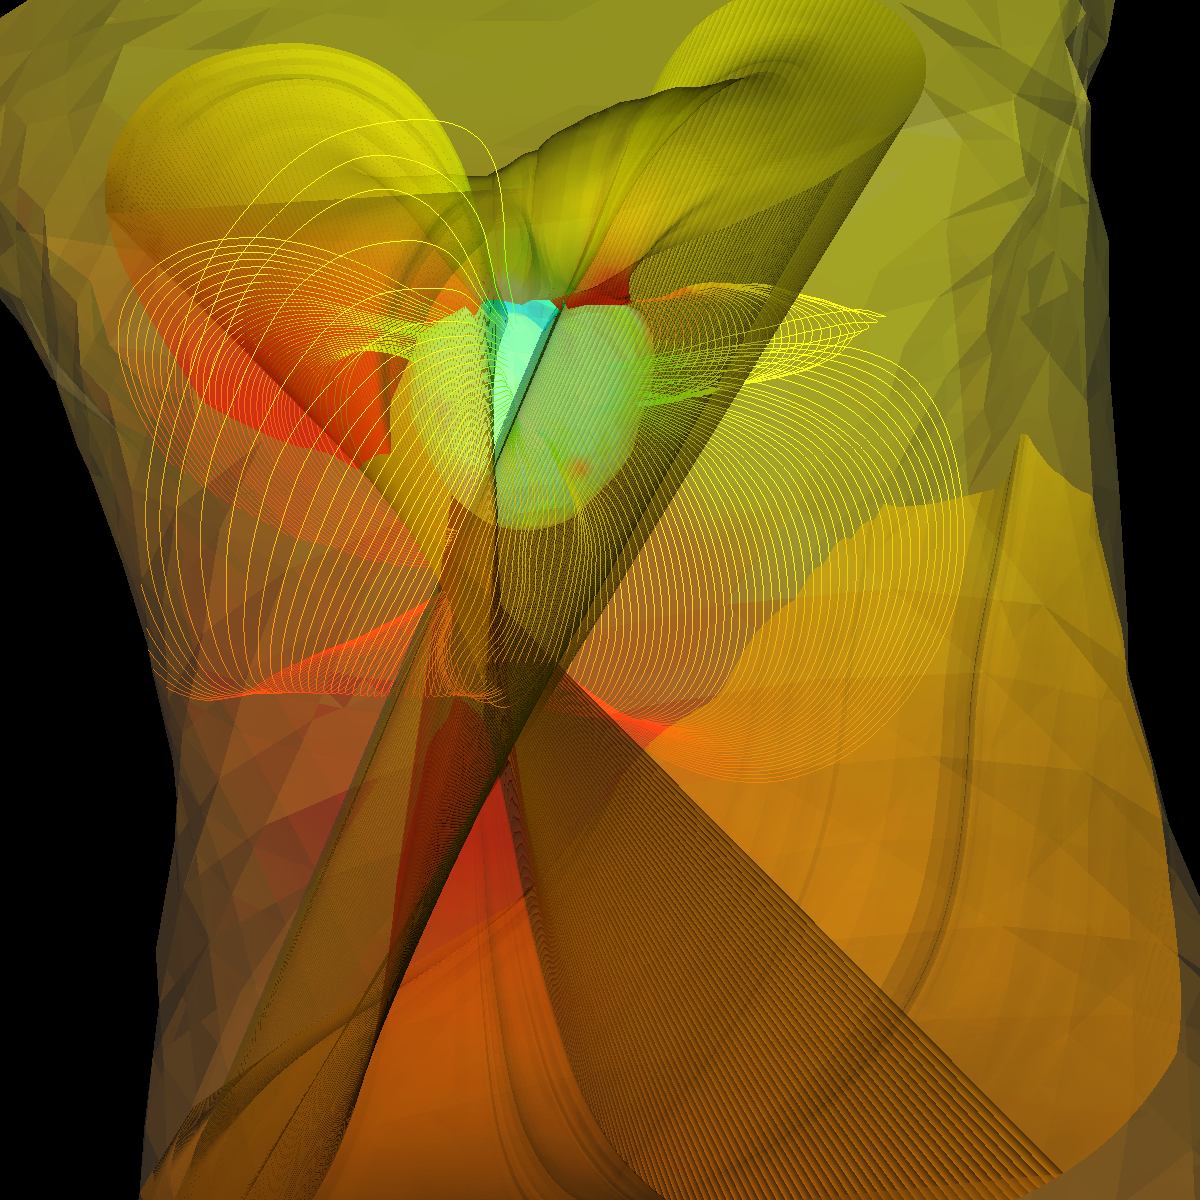
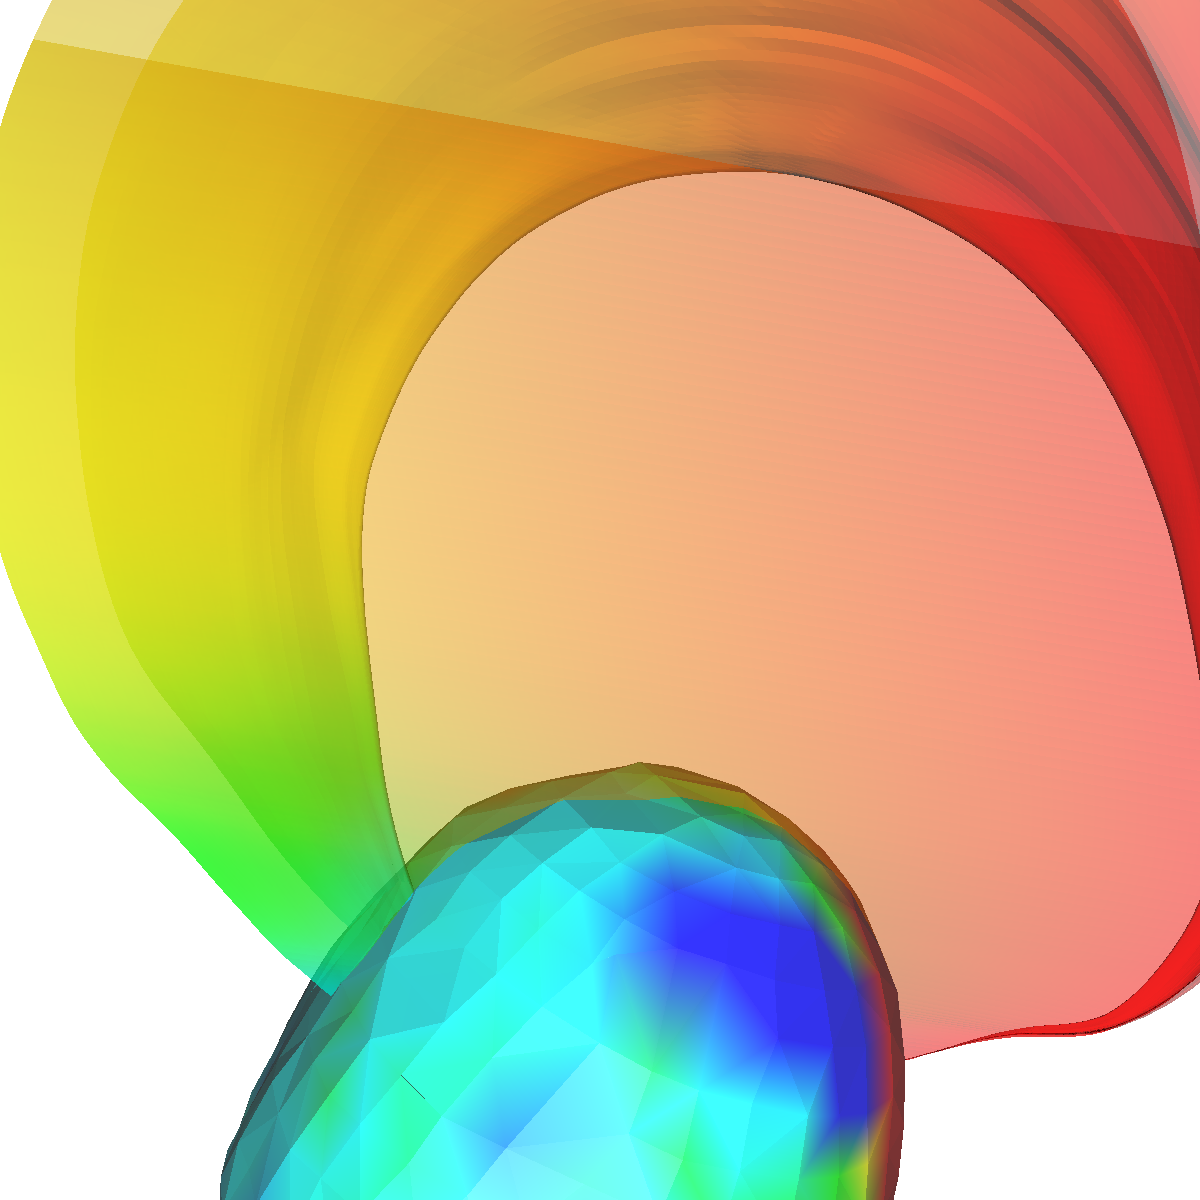
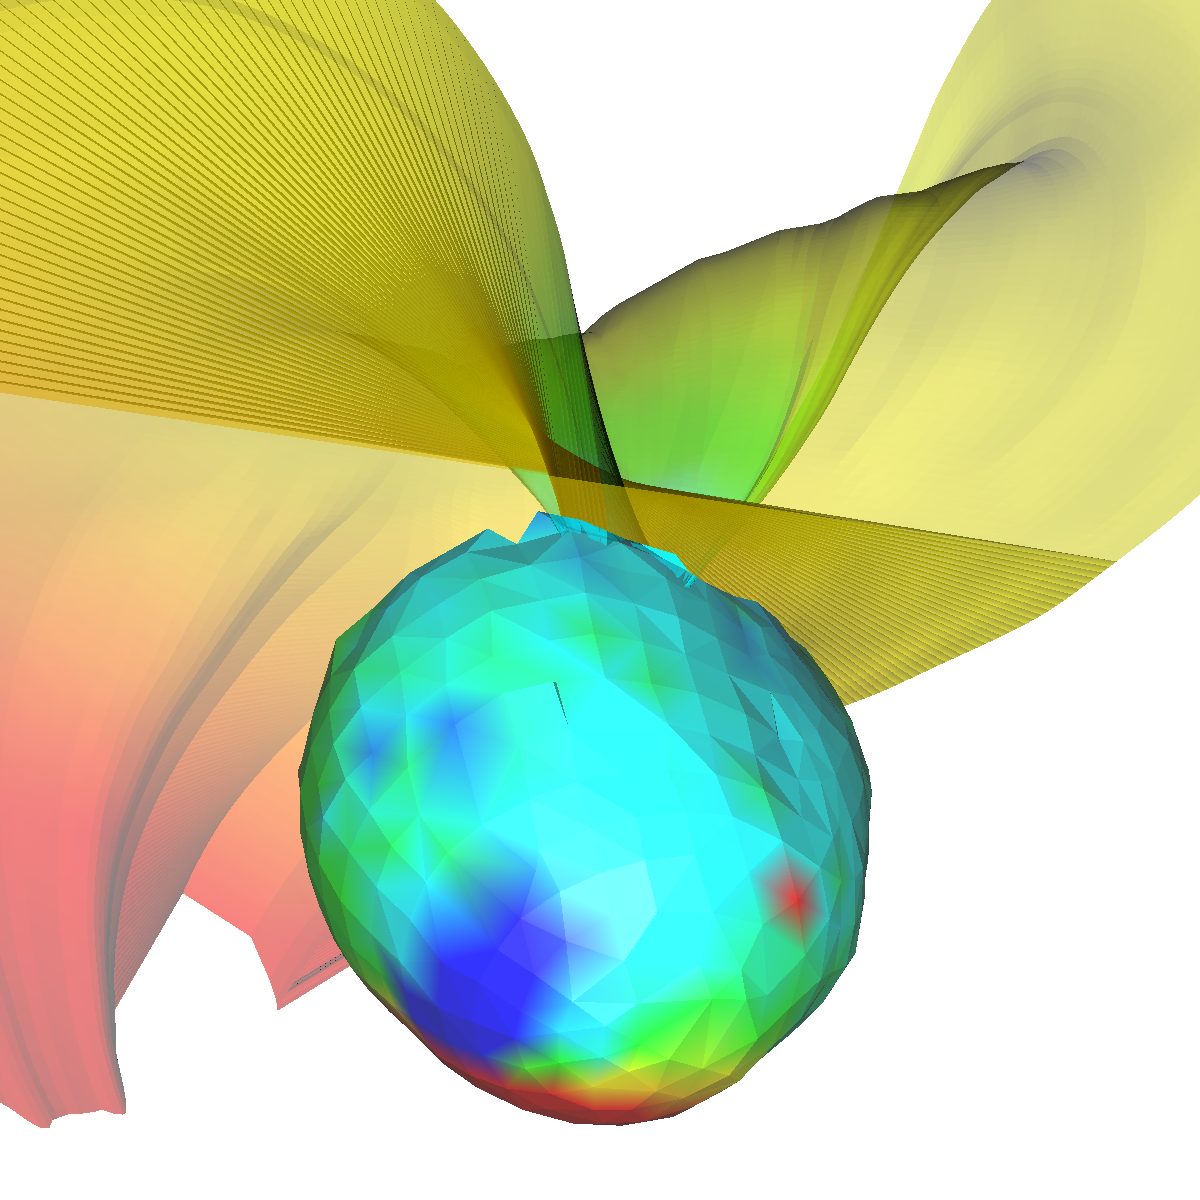
Part 1.7: Bioelectric Structure The renderings below capture a significant structure or pattern with respect to the bioelectric flow below the epicardium . This feature is captured using a stream surface seeded along a line defined at the points [(50 -6 200), (-50 -6 200)]. This feature provides significant insight into the nature and limit sets of the streamlines. |
Part 1.8: Probing with Cutting Planes In this rendering, a cutting plane is applied and probed along the x axis at the location [-35 -6.73 192.53] centered with respect to the skin boundary dataset. We probed using the corresponding vector field. The initial motivation was to use LIC to visualize the flow features using textures. However, there were a few problems that could not be resolved given the time constraints. We also tried applying glphys along the probe plane but we also ran into mysterious problems. The issues are most likely due to the unstructured grid. Nevertheless, we also tried applying isosurfacing and volume rendering, but did not find anything as striking as the vector visualization techniques. |
